Alive and Well: R&D Spending at Instrument and Lab Product Companies
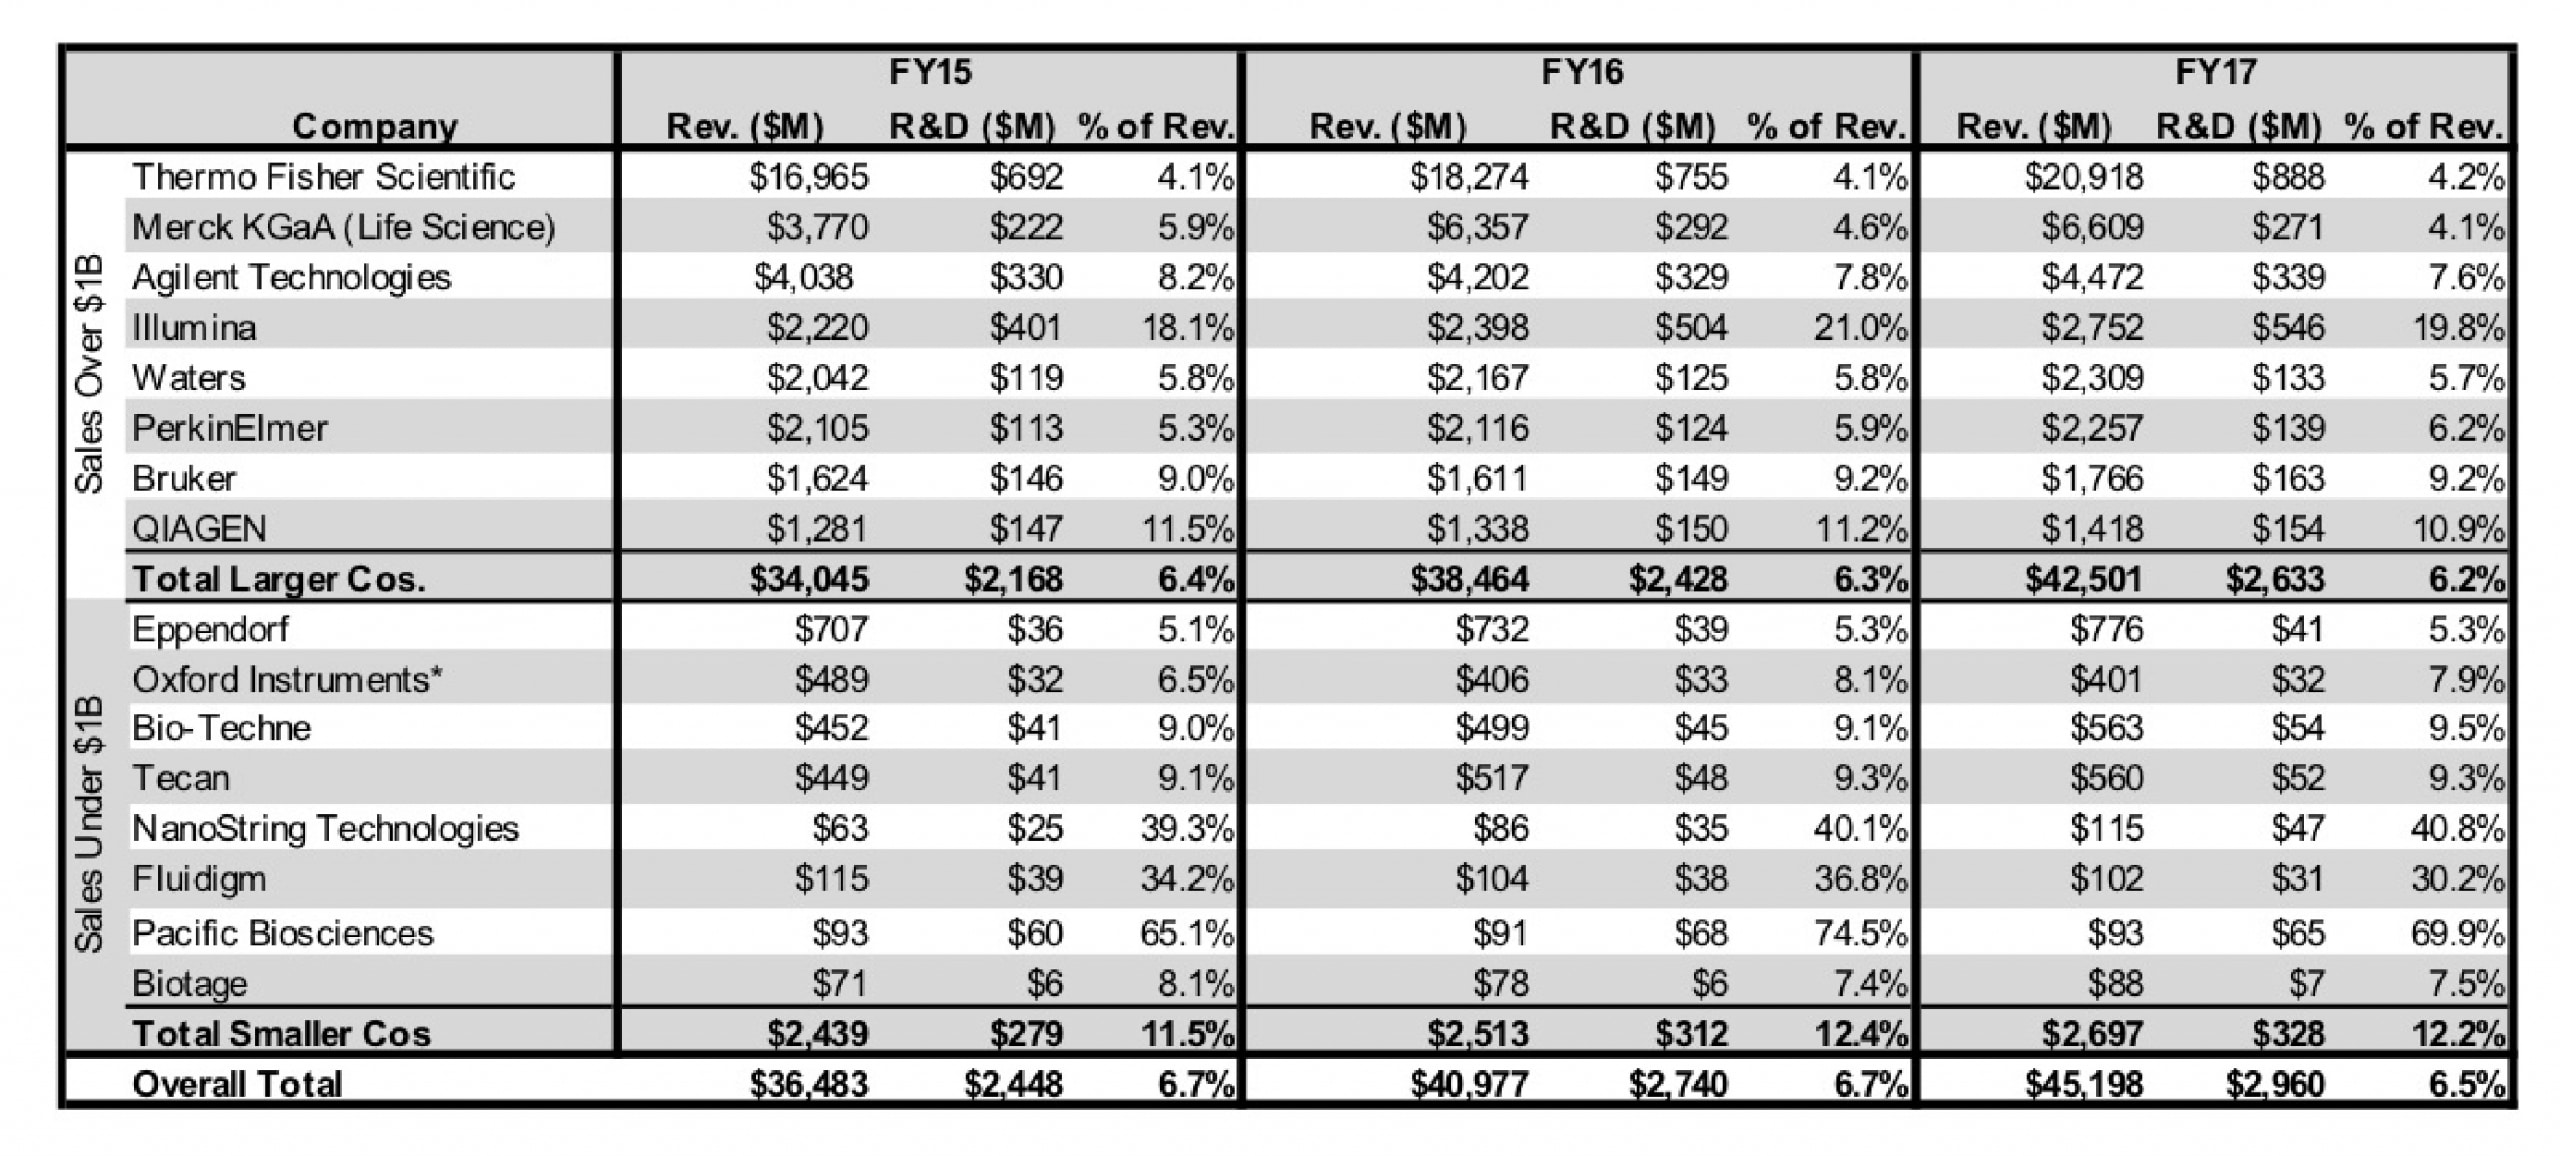
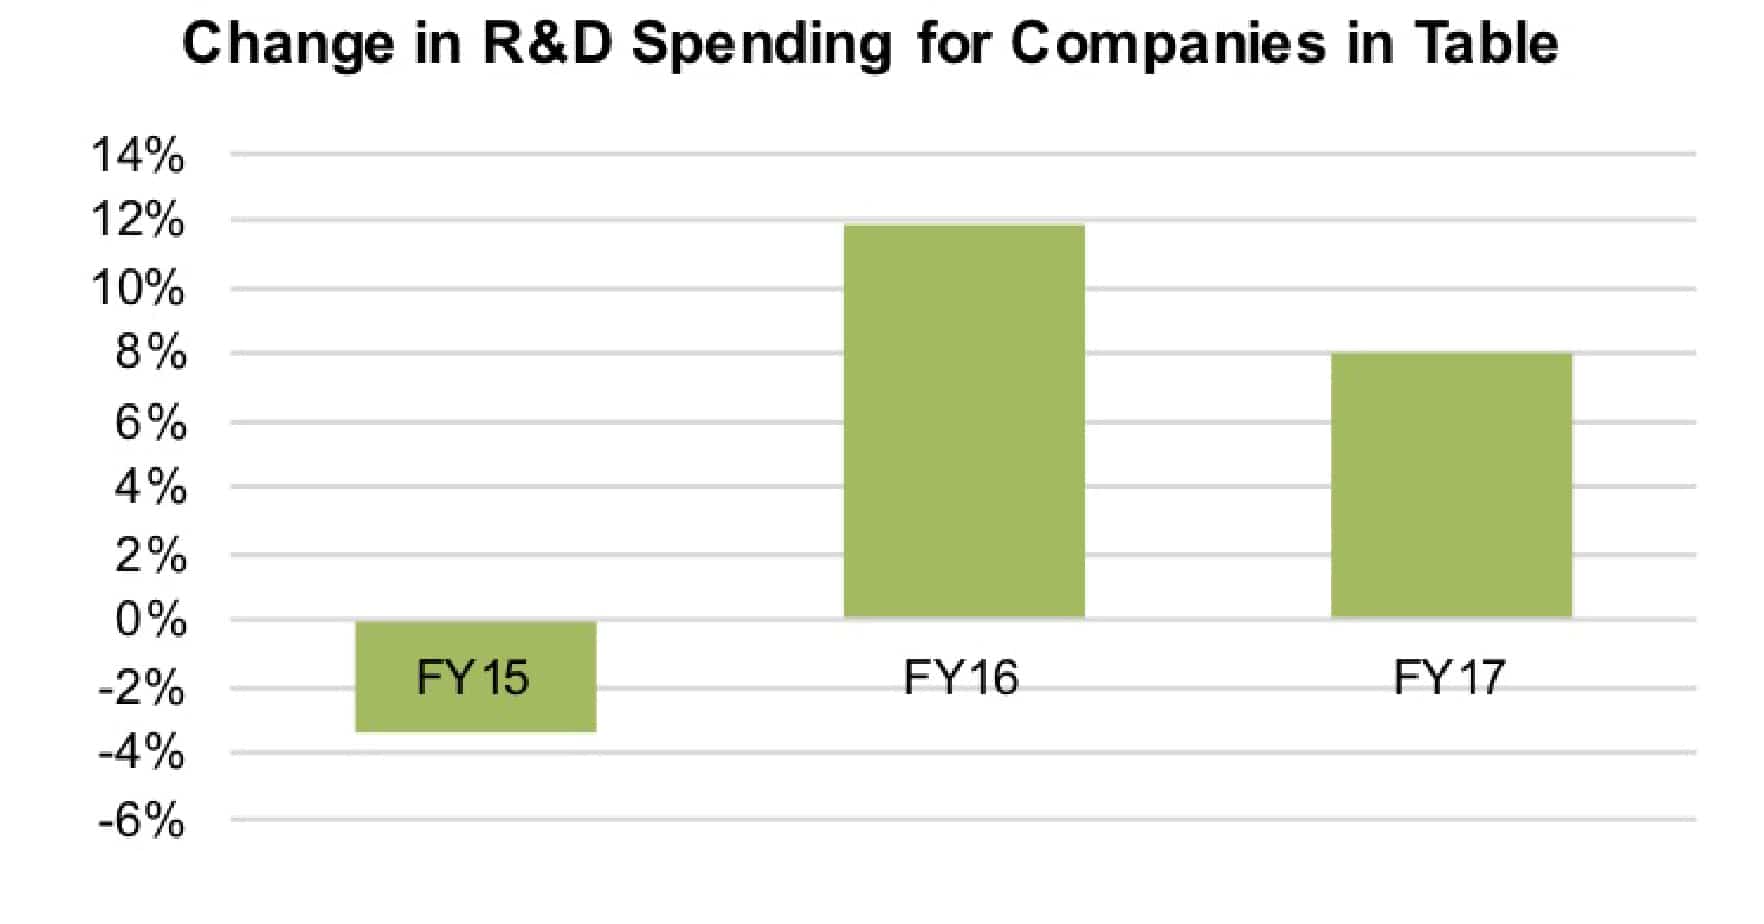
In fiscal 2017, combined R&D spending as a percentage of revenues in US dollars for 16 analytical instrument and laboratory product companies was 6.5%, or nearly $3 billion, down two-tenths of a percentage point from the year before (see table below). The median ratio was 8.5% in FY17 compared to 8.6% in FY16.
Click to enlarge
In fact, the ratio of sales to R&D for companies in the table remained nearly the same in fiscal 2017 despite slower sales growth year over year. Revenue for all companies in the table increased 10.3% in FY17, down from 12.3% growth in FY16 (which included an over 65% increase in FY16 sales for Merck Life Science following the purchase of Sigma-Aldrich [see IBO 9/30/14]).
The review of annual R&D spending is based on fiscal 2017 sales (with the exception of Oxford Instruments) for 15 public and 1 private company (Eppendorf) as reported in company financial documents and presentations. The figures in the main table are based on final results converted into US dollars.
Spending Big: Double-Digit R&D Spending as a Percentage of Sales
Five of the 16 companies in the table spent a double-digit percentage of their annual revenues on R&D last fiscal year. The highest percentages belonged to long-read sequencer maker Pacific Biosciences (60.9%); NanoString Technologies (41.2%), which makes instruments and reagents for molecular profiling; and Fluidigm (30.2%), whose products include microfluidic-based PCR and mass cytometers for protein analysis in single cells.
Despite these companies’ dedication to R&D, NanoString Technologies was the only one among these three firms to increase its R&D spending in FY17. Last fiscal year, the company’s expenditures jumped 35.0% to make up 41% of revenues. This is in line with the company’s broadening of its product line beyond its flagship digital barcoding technologies to develop and commercialize two new technologies: Digital Spatial Profiling for analysis of protein and gene expression, which is scheduled for full release in 2019; and the Hyb & Seq next generation gene sequencing platform, which is scheduled to be fully commercialized in 2020. This is reflected in the company’s breakdown of its R&D costs that show a 61.4% increase in R&D spending for Platform Development to make up 22%, the largest percentage of R&D spending. The company attributed most of the increase to personnel costs.
Although Fluidigm and Pacific Biosciences both had ratios of R&D to sales in the double digits in FY17, they were also 2 of the 4 companies in the table to post declines in R&D spending last fiscal year. Respectively, the companies’ R&D spending fell 19.8% and 3.4%. Both companies recorded improved revenues in 2017 but this was not the case in 2016, when sales declined. These declines may have been a contributing factor to their choice to reduce R&D expenditures in 2017. Consequently, both companies’ R&D spending as a percentage of sales also declined in fiscal 2017. Fluidigm attributed the decrease to cost cuts and fewer projects. Pacific Biosciences noted a decline in chip development costs.
Click to enlarge
Illumina and QIAGEN also spent a double-digit percentage of sales on R&D in FY17, and were the only companies with sales over $1 billion to do so. The companies also happen to be the only exclusively life science–focused instrument and consumables companies among the firms in the table with over $1 billion in sales. As shown in the table, both companies have a maintained a steady ratio of R&D to revenues over the years, consistent with the pace and competitiveness in the development of software, consumables and instrumentation for life science and diagnostic applications.
Nonetheless, Illumina’s increase in R&D spending last fiscal year was slower than the year before. In FY17, R&D spending jumped 8.3%, compared to a 25.7% boost in FY16. Even excluding Illumina’s FY16 R&D investments in spinouts GRAIL and Helix, Illumina’s core R&D spending rose 15% that year. Notably, Illumina introduced its new generation instrument platform for NGS, the NovaSeq, in January 2017, whose development might have contributed a substantial R&D increase FY16. In FY17, the company attributed its latest R&D spending increase specifically to a rise in headcount.
Dedicating Resources: Fastest Growing R&D Spending
Thirteen of the 16 companies in the table reported an increase in R&D spending last fiscal year. Out of these firms, 5 boosted their R&D expenditures double digits in FY17—NanoString (35.0%), Bio-Techne (18.4%), Thermo Fisher Scientific (17.6%), Biotage (13.8%) and PerkinElmer (12.1%). For 4 of these 5 companies, the boost was in line with double digits increases in sales: NanoString (32.9%), Bio-Techne (12.8%), Thermo Fisher Scientific (14.5%) and Biotage (12.0%).
As with NanoString, Bio-Techne’s increase suggests a major investment in new technology platforms, including Advanced Cell Diagnostics (see IBO 7/15/16), which develops RNA-ISH technology. The fastest increase in R&D spending for the company went to one business segment, Biotechnology, where it climbed 31.6% to make up 66% of total R&D spending. In contrast, R&D expenditures for the Protein Platform division declined 1.2% to make up 27%. Diagnostics division spending was flat.
Thermo Fisher Scientific also recorded a double-digit increase in R&D spending last year of 17.6%. The rise can likely be attributed in part to the company’s purchase of Patheon (see IBO 5/15/17). Although overall R&D as a percentage of sales was 4.2% for the company, the percentage of R&D as manufacturing revenue was 6.6% (second quarter of 2017 through first quarter of 2018), up from 6.4% over the same period in 2016–17. As the company is a major distributor and service provider, the latter figure represents a more accurate estimated in terms of product development.
Swedish firm Biotage also reported a double-digit increase in R&D expenditures, growing 13.8%, slightly ahead of sales growth of 12.0%. This contrasts with flat R&D spending in FY16. Nonetheless, the company maintained its R&D as a percentage of sales at around 7%.
PerkinElmer’s R&D spending rose 12.1% last fiscal year. PerkinElmer indicated a sizable investment in a new technology, the Vanadis, using cell-free DNA for screening for aneuploidies (see IBO 1/30/16). The increase also includes the acquisition of EUROIMMUN, completed late last year (see IBO 6/30/17). Based on pro forma 2017 sales and R&D spending for the combined companies, R&D as a percentage of sales would have been 6.5% for PerkinElmer in 2017. PerkinElmer, like Bio-Techne and NanoString, posted double-digit percentage increases in R&D spending in both fiscal 2016 and 2017.
Declining Sales, Declining R&D?
Four companies in the table posted double-digit declines in R&D spending last fiscal year. Two of these companies, Pacific Biosciences and Fluidigm, had the second- and third-highest R&D spending as a percentage of sales, respectively, among companies in the table. Fluidigm attributed the decrease to cost cuts and fewer projects. Both companies recorded improved sales in 2017, but declines in 2016 sales may have contributed to R&D declines in 2017, as both companies’ R&D spending as a percentage of sales declined year over year.
Merck KGaA Life Sciences and Oxford Instruments also both recorded declining R&D spending in fiscal 2017, falling 7.3% and 3.7%, respectively. However, each company’s R&D as a percentage of sales remained steady. Merck Life Sciences’ R&D spending was impacted by a sudden increase in 2016 due to the acquisition of Sigma-Aldrich. Oxford Instruments’ R&D spending was impacted by the divestiture of its Industrial Analysis business (see IBO 4/30/17).