Second Quarter Results: Bio-Techne, Fluidigm, Hitachi High-Technologies, NanoString, Pacific Biosciences and QIAGEN
Bio-Techne Finishes Fiscal 2017 on a Strong Note
Fiscal fourth quarter sales for Bio-Techne advanced 16.2% to $156.6 million. Organically, fourth quarter sales rose 8.0%, for which currency translations negatively impacted sales by 1% and acquisitions lifted sales by 9%. For the full fiscal year, total sales advanced 12.8%, 6.0% organically, to $563.0 million.
Biotechnology sales increased 15.2% to $97.2 million, 2.2% organically, for the quarter. Acquisitions added 14% to segment sales, while currency translation negatively impacted sales by 1%. The strong growth came from antibody revenues, primarily the Novus brand, for which sales grew by double digits. Adjusted operating margin for the quarter was 49.3%, down 3.1 percentage points due to acquisition costs. For the year, segment sales were $364.5 million, a 14.9% increase. Organically, sales rose 4.2%, as acquisitions and currency translations added around 10% to sales growth. Fiscal full-year adjusted operating margin fell five percentage points, again, due to acquisition costs related to Advanced Cellular Diagnostics (ACD).
For the quarter, Diagnostics sales rose 14.0% to $32.6 million. All sales growth was organic. Sales growth for the quarter came primarily from the favorable timing of customers’ orders and shipments. Adjusted operating margin for the segment grew 70 basis points to $32.1%, driven by volume leverage. For the fiscal full-year, segment sales increased slightly by 3.0%, organically. Fiscal full-year adjusted operating margin, however, fell 2.4 percentage points to 26.7% due to the margin mix of product sales.
Protein Platform revenue for the quarter leaped 21.8% to $26.8 million. Currency translation unfavorably impacted sales by 2%. Organically, sales grew 23.8%, the sixth consecutive quarter of double-digit organic growth. Segment growth for the quarter was driven by positive Biologics product sales, strong biopharmaceutical end-market demand, and particular strength in the European and Asian regions. Adjusted operating margin for the segment jumped 8.7 percentage points to 16.2% due to strong productivity gains. For the fiscal full-year, segment revenues rose 18.0%, or 19.0% organically, to $91.5 million. Full year adjusted operating margin increased by 5.9 percentage points to 10.5%, driven by strong volume leverage.
Overall, for the life science research market, both segments, Biotechnology and Protein Platforms, combined for an organic revenue growth of 7.0% for the quarter and full year.
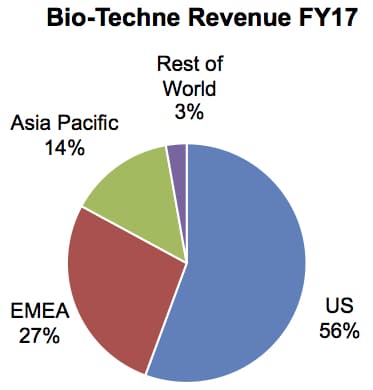
For the year, the US represented the largest fraction of the company’s total regional revenues, at 56%. Sales in the US grew 13.5% for the year to $313.2 million. Organically, sales for the region grew in the mid-single digits. US sales were backed by strong biopharmaceutical demand and solid academia end-market sales. For the EMEA region, sales leaped 16.8% to $153.5 million, as Europe experienced strong double-digit growth. Sales for Europe advanced over 10% organically, as biopharmaceutical sales grew over 11% and academic sales increased around 10%.
In the Asia Pacific region, China experienced the highest sales growth, increasing in the high single digits organically in the fourth quarter. Sales of the company’s Western brands grew over 30% in China, which was partially offset by the CFDA’s shutdown of immunotherapy due to Baidu’s scandal a year ago. For the fiscal full-year, Chinese sales grew 25% for its Western brands. Japan recovered partially, with sales growing in low single digits for the year and mid-single digits for the quarter. The rest of the APAC region continued its strong performance, with sales increasing in the high single digits.
Bio-Techne’s outlook for fiscal year 2018 remains positive, as the company believes organic sales growth will be similar to that of the previous year. Bio-Techne expects its Diagnostics segment sales to be higher due to new projects and, conversely, sales for its Protein Platforms business to be slightly softer than the previous year.
Fluidigm Plunges For Second Quarter
Second quarter sales for Fluidigm declined 15.2% to $23.9 million, primarily due to decreases in instruments and consumables revenues. Sequentially, total sales declined 6.3% from the first quarter.
Product revenue decreased 21.0% to $19.5 million. Of the customers in this segment, 73% were research based while 27% were applied based. Instrument revenue declined 24.8% to $9.9 million due to a decrease in sales of genomics instruments, primarily single-cell genomics instruments. Additionally, lower average selling prices of the C1 and Helios systems further added to the decline of sales.
Consumables revenue fell 17.0% to $9.6 million. Despite increased sales for mass cytometry reagents, decreased sales of genomics consumables, in particular IFCs, drove overall consumables revenue down. Service revenue leaped 27.4% to $4.3 million primarily due to an increase in post-warranty service contracts and service parts sales. Service sales added to both genomic and mass cytometry revenues.
By market, genomics product sales tumbled 35.1% due to lower single-cell and high-throughput genomics revenues. Single-cell genomics product revenue declined at rates in line with company expectations and accounted for around 8% of total product revenue. Conversely, mass cytometry experienced solid demand as consumables and service revenues both increased. Mass cytometry product revenue rose 8.9% to $8.6 million due to strong consumables sales growth. Year to date, mass cytometry revenue growth is up double digits across the instruments, consumables and service segments.
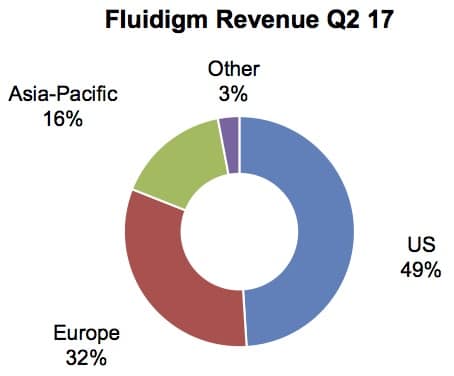
Geographically, all regions experienced a decline in sales. Sales in the US decreased 16.0% to $11.7 million, accounting for 49% of total company revenues. The decrease was largely driven from lower mass cytometry instrument sales as well as lower genomics consumables sales. European sales declined 8.0% to $7.7 million, primarily due to lower genomics product sales. Revenue from the UK represented 13% of total company revenue, while European sales accounted for 32% of total revenues. Revenues for the Asia-Pacific region sunk slightly by 3.0% to $3.9 million, in part due to lower sales for genomics consumables. Revenues from China added $2.8 million to total APAC sales and represented around 12% of total revenues. Revenue for the Asia-Pacific region accounted for 16% of total company revenue. Revenues from other regions decreased 67% to account for 3% of total company revenue.
For the third quarter, Fluidigm expects total revenues of $24–$26 million, an upgrade over the previously projected $22–$24 million. The new projection represents an increase of 8%–17%.
Hitachi Slips for Fiscal First Quarter
For the fiscal first quarter of 2018, Hitachi High-Technologies’ Science and Medical Systems (SMS) sales declined 13.3% to ¥39.7 billion ($357.6 million at ¥111 = $1). Similarly, operating income decreased by ¥4.7 billion ($42.3 million) to ¥45.0 billion ($405.4 million).
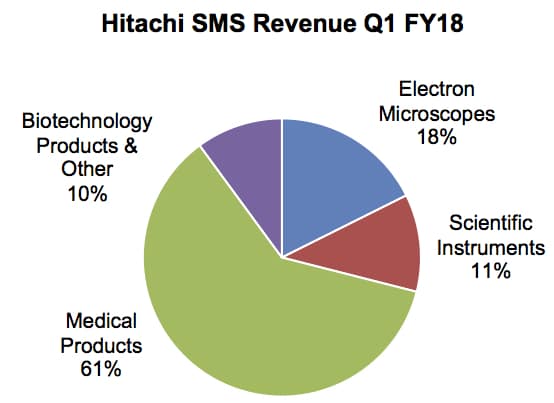
Within Hitachi’s SMS segment, electron microscopes and biotechnology products grew the fastest, percentage-wise. Electron Microscopes sales vaulted 40.0% to ¥7.0 billion ($63.0 million), representing around 18% of total SMS revenue. The growth came from a strong revival in demand in the Japanese and European regions. Biotechnology Product revenue also grew in double digits, increasing 25.0% to reach ¥4.0 billion ($36.0 million). However, Medical Product revenue fell 27.3% to ¥24.2 billion ($218.0 million), still accounting for a majority of total SMS revenue, at 61%.
For the first half of fiscal 2018, Hitachi High-Technologies expects its SMS segment to record sales of ¥84.6 billion ($762.1 million), representing a decrease of 8.6%. Similarly, operating income is expected to decline by ¥6.4 billion ($57.6 million) to ¥8.1 billion ($72.9 million) due to strategic investments, with hopes of accelerating growth, along with inventory adjustments pertaining to clinical analyzers.
Collaborations Keep NanoString on Top for Second Quarter
NanoString Technologies’ second quarter revenues advanced 52.9% to $34.6 million primarily due to a large increase in collaboration sales. Aside from the continued collaborations with Celgene and Merck, total collaboration sales vaulted 216.8% to $16.3 million due to the termination of the Medivation and Astellas collaboration. The termination resulted in an $11.3 million addition to Collaboration revenue. Similarly, Prosigna (IVD) sales leaped 47.9% to $1.8 million, driven by reimbursement decisions in 2016 along with continued expansion of Prosigna acceptance. Collaborations and IVD revenues accounted for 47% and 5% of total company revenue, respectively.
Overall, product and services revenue increased 4.7% to $18.3 million. Instrument sales fell 6.3% to $6.0 million, primarily due to lower volumes in the US and in Europe. The lowered volume in the US and Europe came in response to higher volume in the APAC region, where average sales prices are lower. Instrument revenue, however, increased 35% sequentially. nCounter SPRINT systems accounted for 40% of Instrument sales, while Instrument sales represented 17% of company revenues.
Consumables revenue, excluding IVD sales, grew steadily at 1.4% to $9.2 million. Total consumables revenue, including IVD sales, advanced 7.0% to $11.0 million. Solid Consumables revenue resulted from continued growth of the company’s installed base of instruments. Panel products’ continued strength lifted sales higher, as they account for over 50% of the company’s life science Consumables revenue. Overall, consumables revenue accounted for 27% of total company revenue.
Service revenue increased significantly, by 69.5%, to $1.2 million. The large increase was primarily due to the expansion of instruments covered by service agreements as well as the initiation of sample processing under the company’s new Digital Spatial Profiling (DSP) technology-access program. Service revenue accounted for 4% of total company revenues.
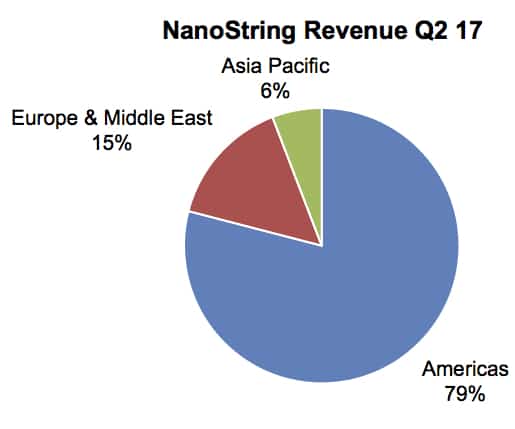
Geographically, the Americas accounted for a majority of total company revenue, at 79%. Revenue for the region increased 67.5% to $27.3 million, where the US represented 98% of the region’s revenue. Revenue in the US leaped 70.7% to $26.8 million. Sales for the EMEA region grew 7.3% to $5.2 million, while sales in the Asia Pacific increased 41.0% to $2.0 million.
For the full year, NanoString raised its previous projection of $100–$105 million to $114–$118 million due to the increase and growth in collaboration sales. The upgraded full-year sales projection represents an increase of 32%–36%. Product and services revenue guidance remained the same and, as such, is expected to range between $81 million and $85 million.
Product and Service Revenues Lift Pacific Biosciences
Second quarter revenue for Pacific Biosciences reached $20.1 million, a 17.0% increase, excluding the $3.6 million of terminated contractual revenue (see IBO 12/15/16).
Instrument sales dropped 17.4% to $7.1 million due to unfavorable customer-installation timing. Conversely, consumables revenue advanced 88.0% to $9.4 million, driven by strong growth in Sequel instrument utilization as well as an increase in the installed base. As of the second quarter, consumables revenue had grown for six consecutive quarters. Consumables revenue generated from the Sequel installed base exceeded those generated from the RSII installed base. The number of installed base systems reached well over 300.
Product revenue leaped 21.8% to $16.5 million, largely driven by increased consumables sales. Of the $16.5 million, Sequel and RSII instruments sales reached $7.1 million, accounting for 43% of overall product revenue. The remaining $9.4 million was from the sales of consumables. Service and other revenues slid 1.1% to $3.5 million.
Adjusted product and service gross margin decreased 1.5 percentage points to 39.9% due to higher product costs. Geographically, China represents approximately 25% of total company revenues. The company expects to see continued strength in its China businesses.
For the full year, Pacific Biosciences maintained its guidance for product and service revenue growth of 35%–45%. The company projects a significant improvement in throughput over the next two years, enabling Pacific Biosciences to provide low cost genomes.
QIAGEN Remains Solid in Second Quarter
Second quarter revenues for QIAGEN remained healthy as net sales advanced 4.4% to $349.0 million on a reported basis. Despite fewer working days, the company still produced organic revenue growth of 4.0%, in line with its expectations. Currency exchange movements negatively impacted sales by two percentage points. Acquisitions added about 2% to reported sales, as Exiqon (see IBO 6/15/16) and OmicSoft (see IBO 1/15/17) provided solid revenues.
Instrument sales were soft for the second quarter, declining around 4% on a constant currency basis. Instrument sales accounted for 12% of total company sales. Despite strong sales of the QIAsymphony automation system, other instruments saw lower-than-expected sales growth.
Consumables and related revenues for products advanced 8.0% on a constant currency basis. The strong growth was due to continued momentum from the first quarter. Consumables accounted for 88% of total company sales.
Molecular Diagnostics sales advanced 4.0% on a reported basis and 6.0% in constant currency. Revenue for the segment reached $168.0 million due to strong QuantiFERON TB sales, reaffirming the company’s full-year sales target of 25% for the QuantiFERON TB. In addition, QIAsymphony automation system consumables sales increased double digits, furthering segment sales growth. For the quarter, Molecular Diagnostics segment revenue accounted for 48% of total company revenues.
By segment, Academia sales improved slightly, up 2.0% on a reported basis to $78.0 million. On a constant currency basis, sales grew 4.0% as overall regional sales growth increased. Additionally, instruments, consumables and related revenues grew modestly, lifting segment growth higher. Year to date, segment sales have grown 3.0% on a constant currency basis, accounting for 22% of total company revenues.
Pharmaceutical sales rose 5.0% on a reported basis to $70.0 million, but sales rose 8.0% on a constant currency basis. Foreign currency movements negatively affected sales by 3%. The segment experienced strong growth due to substantial gains from consumables and sample technologies sales. Additionally, the EMEA region and the Americas both lifted Pharma sales for the quarter. However, instrument sales slightly offset overall Pharma sales growth. For the quarter, Pharma sales represented 20% of total company sales.
Applied Testing sales grew 10.0% to $33.0 million on a reported basis. On a constant currency basis, sales advanced 12.0%, surging ahead of expectations due to strong volume growth in forensics and human ID testing. Additionally, all regions performed well for the segment, adding positive growth to sales. Applied testing revenue accounted for 10% of total company revenues.
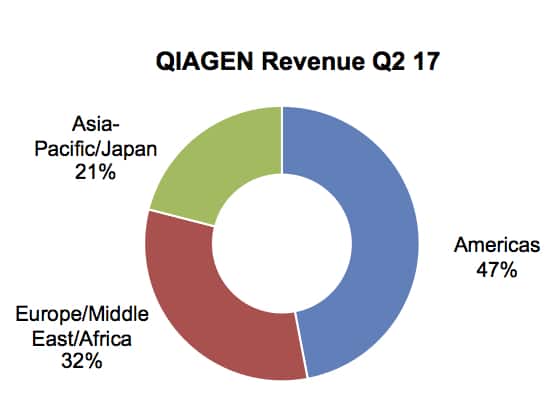
Geographically, all regions experienced positive sales growth. Sales in the Americas advanced 4% on a constant currency basis, as adjusted net sales reached $164 million. Steady growth in the Americas came primarily from improved revenues in the US and Brazil. However, revenues from Mexico partially offset the gains due to the timing of a national tender. In the Asia Pacific region, sales jumped 10% on a reported basis, or 12% on a constant currency basis, to hit $74 million. Strong growth for the APAC region was led by robust revenue growth in South Korea, India, and Taiwan. Furthermore, significant growth in QuantiFERON TB sales also lifted the region’s overall revenue. However, revenue in Japan remained mostly flat, unchanged from a year ago. In the EMEA region, sales were solid as they advanced 8% on a constant currency basis to $112 million, largely due to strong sales in France and the UK. However, Germany experienced a weaker quarter, as sales declined slightly. As for the Middle East, sales continued to grow and added to overall regional sales growth.
For the third quarter, QIAGEN expects adjusted net sales to grow at about 7% on a constant currency basis, or 6% organically. For the full year, QIAGEN is upgrading its previous sales growth projection of 6%–7% to a whole 7% on a constant currency basis.


