Business R&D Spending Robust as Industrial Sectors Rebound
R&D Overview
“The 2018 EU Industrial R&D Investment Scoreboard,” a report published this month by the European Commission’s (EC) Joint Research Center, reviews R&D spending for the 2017–18 fiscal year (or the latest fiscal year for which company financial information was available) for the 2,500 public companies with the greatest annual spending on R&D. This spending represents roughly 54% of annual R&D investments, according to the EC. The results show total R&D spending growth for these firms accelerated, up from 5.9% a year ago.
Total spending by the 2,500 companies in the R&D Scoreboard rose 8.3% in the latest year to €736.4 billion ($827.4 billion at €0.89 = $1), its fastest growth since 2011 and an acceleration from last year’s 5.9% increase. R&D intensity (R&D as a percentage of sales) was 4.0%. However, investments were heavily weighted towards the biggest spenders, with the top 50 companies accounting for 40% of the Scoreboard’s total R&D spending.
Scoreboard companies are divided into 8 major industry sectors made up of 15 sub-categories, which in turn are a compilation of 39 classifications. By industry, R&D spending in 2017–18 was led by the ongoing surge in spending by the ICT (information and communications technologies) industry, which consists of 11 sub-categories (ICT Producers: Computer Hardware, Electrical Components & Equipment, Electronic Equipment, Electronic Office Equipment, Semiconductors, Telecommunications Equipment; and ICT Services: Computer Services, Fixed Line Telecommunications, Internet, Mobile Telecommunications, Software). R&D expenditures by the 809 ICT companies in the Scoreboard increased the fastest as they rose 11.3% and 13.0% for ICT Producers and Services, respectively.
Another game changer in recent years for the R&D landscape has been Health, which comprises four sub-categories (Biotechnology, Health Care Providers, Medical Equipment, Pharmaceuticals). In 2017–18, R&D spending by the Health sector, consisting of 409 Scoreboard companies, grew 7.7%. As the report emphasizes, both the ICT and Health sectors, as well as the Automobiles industry, have influenced R&D spending trends over the last decade, with each evolving to account for larger shares of total Scoreboard R&D spending.
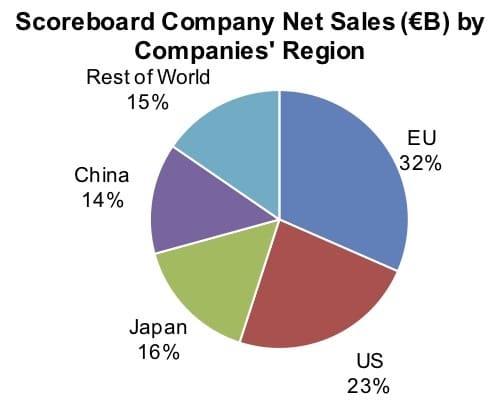
The Scoreboard also tracks additional company results, such as net sales, operating profits and capital expenditures. In 2017–18, total net sales for Scoreboard companies rose 9.8%, growing faster than R&D for the first time since 2011, to €18,448 billion ($20,773 billion). In fact, sales rose for all industrial sectors, led by oil and gas producers’ 21.3% increase.
Scoreboard companies’ operating profits grew 22.6% to €1,909.3 billion ($2,145.3 billion), again led by oil and gas producers. Their profitability rose 274.1% due to oil price increases. For all 2,500 Scoreboard companies, capital expenditures rose 5.1% to €1,151.3 billion ($1,293.6 billion), increasing after three years of declines.
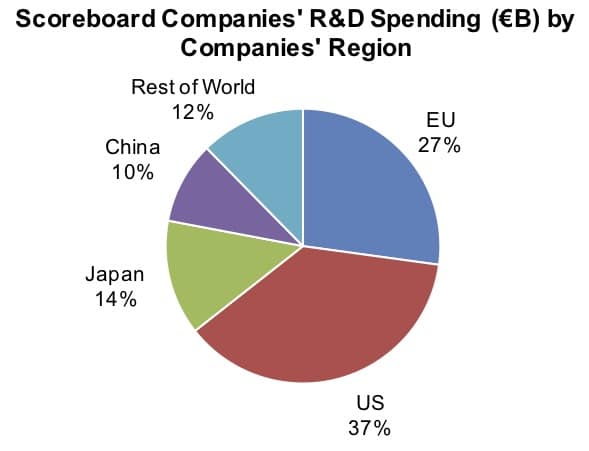
The report also analyzes results by region and country. By country, the highest number of companies in the Scoreboard are headquartered in the US, China and Japan at 37%, 10% and 14%, respectively. Among these countries, China’s growth continues to surpass the others. R&D expenditures by the 438 Chinese companies in the Scoreboard rose 20.0%. At the same time, net sales for these firms grew 17.9% and net profits were up 34.7%.
Sector Review
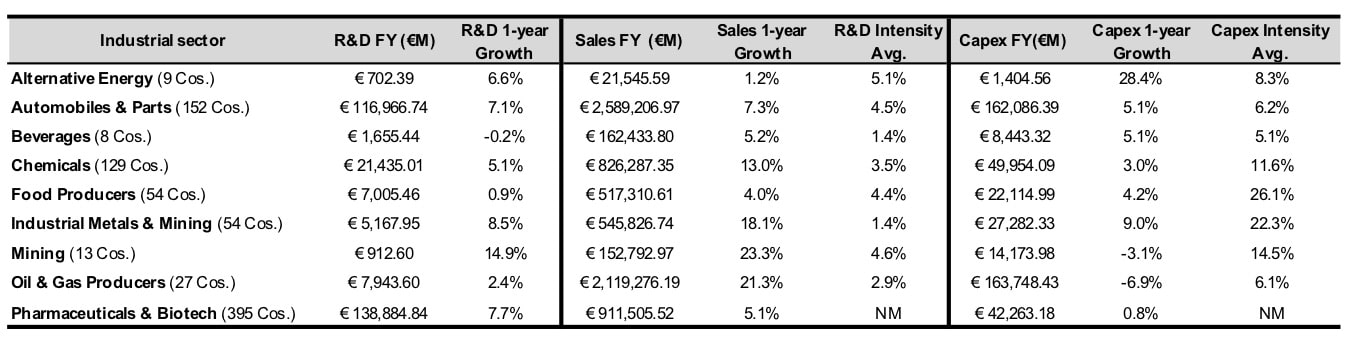
The table below reviews the results for nine sectors that are major end-users of analytical instrumentation and laboratory products. IBO has calculated the R&D, sales and capital expenditure (capex) results for all the companies in a particular sector for which year-over-year information was available.
Pharmaceuticals & Biotech
R&D spending for the 395 Pharmaceutical & Biotech companies in the R&D Scoreboard rose 7.7% in 2017–18 to €138.9 billion ($156.1 billion), the highest amount among all Scoreboard industries. But these companies’ percentage increase in annual R&D spending trailed that of the Scoreboard overall, and was surpassed by R&D spending increases of the Software & Computer Services, Electronic & Electrical Equipment, Construction & Materials and Technology Hardware & Equipment sectors at 13.6%, 12.4%, 12.1%, 10.8%, respectively.
Nonetheless, the Pharmaceutical & Biotech industry’s growth in R&D investment far surpassed its 5.1% and 0.8% increases in its sales and capital spending, respectively (see table above). However, R&D spending declined for 29% of companies, and sales were down for 26%.
The top 10 Pharmaceutical & Biotech companies in the Scoreboard by R&D expenditures for 2016–17 (Johnson & Johnson, Bayer, Pfizer, Roche, Novartis, Sanofi, Merck, GlaxoSmithKline, Gilead Sciences, Abbvie) spent a total of €61.7 billion ($69.3 billion) on R&D in 2017–18, a 9.2% jump. These companies accounted for 44% of all Pharmaceutical & Biotech Scoreboard companies’ R&D. Despite their R&D heft, 3 of these companies (Pfizer, Novartis, Gilead Sciences) cut R&D spending last year, and net sales for 4 of them (Bayer, Pfizer, Sanofi, Gilead Sciences) declined.
Sales and capex growth for the top 10 was slower than for the sector as a whole.
But sales and capex growth for the top 10 was slower than for the sector as a whole. In fact, total net sales for the top 10 Pharmaceutical & Biotech Scoreboard companies rose only 1.3% to €388.8 billion ($439.9 billion). In addition, their capex fell 4.0% to €17.3 billion ($19.4 billion). Thus, average R&D intensity was 16.1% and average capex intensity was 4.3%.
Thirty-three of the Pharmaceutical & Biotech companies in the Scoreboard are Chinese companies. Although R&D spending for these companies grew 38.9% in 2017–18, the total amount of spending is still relatively small at €2.3 billion ($2.6 billion). As with the sector in general, R&D growth outpaced sales growth, which rose 13.7% to €79.7 billion ($89.6 billion). R&D intensity stood at 10.4% on average, lower than the industry average. But capex intensity was 9.4%, higher than the industry average, with annual capex growing 24.7% to €3.6 billion ($4.0 billion).
Chemical Companies
In contrast to the Pharmaceutical & Biotech firms in the Scoreboard, the growth in R&D spending by Chemicals companies in the Scoreboard lagged their robust sales growth, resulting in an R&D intensity of 3.5% in 2017–18. R&D spending by the 129 Chemicals companies rose 5.1% in 2017–18 to €21.4 billion ($24.0 billion) with spending falling for 27% of companies. However, sales rose for 93% of the firms. Sales for all companies increased 13.0% to €826.3 billion ($928.4 million). Capex increased 3.0% to €50.0 billion ($56.2 billion).
R&D investments leaped 43.0% last year.
Strong growth was reflected in the results of the top 10 Chemicals companies in terms of R&D (BASF, DowDuPont, Monsanto, Sumitomo Chemical, Syngenta, Mitsubishi Chemical, Asahi Kasei, Toray Industries, Evonik Industries, DSM). R&D spending grew double-digits for three companies (DowDuPont, Toray Industries, DSM), and only one company cut spending (Syngenta). Total R&D spending for the top 10 firms rose 9.2% to €10.3 billion ($11.6 billion), close to the 13.7% sales growth as sales totaled €237.4 billion ($266.7 billion). As a result, average R&D intensity was 5.4%. Average capex intensity was just ahead at 5.9%, as the top 10’s capex rose 2.2% to €14.2 billion ($16.0 billion).
The Scoreboard includes 20 Chinese Chemicals companies. R&D investments by these companies leaped 43.0% last year to €1.1 billion ($1.2 billion), with a percentage change on track with sales, which jumped 44.9% to €49.2 billion ($55.3 billion). Despite such growth, average R&D intensity was below that of all Chemicals companies at 2.9%. In contrast, average capex intensity was higher at 9.7%, reflecting the 67.3% rise in capex to €5.5 billion ($6.2 billion).
Industrial Metals & Mining
With 32% of the Industrial Metals & Mining companies in the Scoreboard headquartered in China, the country is well-represented in this sector. As with the Pharmaceutical & Biotech and Chemicals sectors, China’s Industrial Metals & Mining companies’ growth in all categories was faster than the industry as whole but from a much lower base. R&D rose 18.3% to €1.7 billion ($1.9 billion), net sales grew 30.2% to €129.8 billion ($145.8 billion) and capex increased 17.9% to €7.1 billion ($8.0 billion). R&D and capex intensity were a respective 2.4% and 7.3%.
Sales were up a robust 17.1% to €301.1 billion ($338.3 billion).
Although behind Chinese firms in terms of growth rate, all Industrial Metals & Mining companies in the Scoreboard had a fruitful year of spending. R&D was up 8.5% to €5.2 billion ($5.8 billion) and capex rose 9.0% to €27.3 billion ($30.7 billion), backed by sales growth of 18.1% to €545.8 billion ($613.3 billion). But average R&D intensity was low at 1.4%, with the average capex intensity of this capital-intensive industry high at 22.3%.
The results for the 10 Metals & Mining Companies in the Scoreboard with the highest R&D spending in 2017–18 (Nippon Steel, Baoshan Iron & Steel, Thyssenkrupp, Posco, Hesteel, JFE, Shanxi Taigang Stainless Steel, Kobe Steel, Arcelormittal, Umicore) mirrored the overall sector. Total R&D expenditures for these companies grew 8.0% to €3.3 billion ($3.7 billion). Sales were up a robust 17.1% to €301.1 billion ($338.3 billion) and capex topped €15.4 billion ($17.3 billion), a 10.8% increase. Average capex surpassed average R&D at 5.4% and 1.4%, respectively.
