Fourth Quarter 2018 Results: Agilent Technologies, PerkinElmer, Shimadzu, Spectris and Waters
Please note that the quarterly IBO Sales Indexes will appear in the March 15th issue.
Low Chinese Sales Cannot Hinder Agilent’s Strong Quarterly Performance
Agilent Technologies’ fiscal first quarter revenues included a 2.2% decline and 1.5% growth from currency and acquisitions, respectively (see Bottom Line). Consumables, services and informatics, together accounting for 56% of sales, increased 1%. Instrument sales grew double digits, accounting for 43% of sales.
Gross margin rose 56.9% to $553 million offsetting a $4 million headwind from Chinese tariffs. Agilent’s operating margin performance also increased making it the 16th consecutive quarter of year-over-year improvement.

Click to enlarge
By end-market, pharmaceutical, environmental/forensics and diagnostics and clinical demand led Agilent’s revenue growth, increasing double digits.
Pharmaceutical and biotech sales rose 10% to account for 30% of company sales, with broad-based growth across all segments and regions. Product lines showing strength included cell analysis and Nucleic Acids Solutions Division products.
Chemical and energy sales grew a modest 2% due to flat instrument sales, which were slightly offset by mid-single-digit growth of services and consumable sales.
Environmental/forensic sales grew 10% due to double-digit growth for Agilent CrossLab and single-digit growth for Life Science & Applied Markets. Highlights included strong demand for GC, GC/MS, atomic spectroscopy, consumables and services. This end-market accounted for 12% of company revenues.
Diagnostics and clinical sales increased 11%, which included strong demand for pathology-related products and double-digit growth for the company’s NGS portfolio. This end-market accounted for 15% of company revenues.
Sales in the food end-market declined 1% to account for 10% of company sales, while academic and government sales were flat, representing 9% of company sales. A contributing factor to the flat sales of the academic and government end-market was the US government shutdown that began in late December 2018. This affected the end-market’s sales performance substantially since the US government is Agilent’s largest customer.

Click to enlarge
Geographically, Agilent saw broad-based gains across all regions. Chinese sales increased a slight 0.8%, which was attributed to both the US government shutdown and the Chinese New Year occurring at the same time. The shutdown resulted in Agilent not possessing an export license for some of its products bound for China. Excluding the Chinese food end-market, which is going through regulatory transitions, Chinese sales grew in the mid-single digits. Other Asia and Japan revenue increased 13%.

Click to enlarge
Life Sciences and Applied Market Group revenue grew modestly, up 0.8% against a tough comparison of 11% from last year. Despite the slower sales growth, there was demand in the pharma and environmental/forensics end-markets.
Sales for the Agilent CrossLab Group included broad-based demand across all end-markets and regions.
Diagnostics and Genomics Group revenue growth also saw broad-based demand across all end-markets and regions. Highlights included the pathology and NGS portfolios’ double-digit sales growth. The segment also saw strong demand for the cancer diagnostics testing portfolio.

Click to enlarge
Agilent expected its fiscal second quarter revenues to total $1.25–$1.27 billion with organic growth of 5.0%–6.0%. A currency headwind of 2.9% is anticipated, partially offset by an M&A contribution of 2.0%–2.2%. For fiscal full-year guidance, Agilent forecast revenue to total $5.15 billion–$5.19 billion with organic growth of 5.0%–5.5%, up $20 million on both the low and high end of the range. The company anticipates a 1.8% currency headwind, partially offset by an M&A contribution of 1.6%–1.9%.
PerkinElmer’s Strategic Business Moves Generate Strong Organic Growth for the Year
Q4

Click to enlarge
PerkinElmer’s fourth quarter 2018 sales grew mid-single digits organically, exceeding the company’s revenue guidance by 2%. Discovery & Analytical Solutions (DAS) division revenue grew in the mid-single digits, while Diagnostics division sales grew double digits organically (see Bottom Line). All figures below are given on an organic basis.

Click to enlarge
Geographically, all major areas experienced revenue growth with double-digit sales growth in the Americas, high single-digit sales increases in Asia and low single-digit sales growth in Europe. This was PerkinElmer’s sixth consecutive quarter of organic revenue growth in all major geographic areas it serves. The emerging market regions represented 40% of total sales, driven by double-digit revenue growth.
DAS sales were led by mid-single digits sales in life sciences and applied markets. Life sciences sales were driven by demand for imaging product lines and informatics. Revenue growth for applied markets was led by high single-digit sales growth in the environmental and academic markets, mid-single digit revenue growth in the food market and low single-digit revenue growth in the industrial market.
Diagnostic division sales were led by the reproductive health and immunodiagnostics businesses. Specifically, the reproductive health business grew in the high single digits due to the 50% growth of the genomics testing business. Tulip Diagnostics revenue grew 20%, which contributed to the immunodiagnostics’ revenue growth.
The company expects its first quarter 2019 revenues to be $643 million, representing 4% growth. This includes a foreign exchange headwind of approximately $27 million.
FYE
Click to enlarge
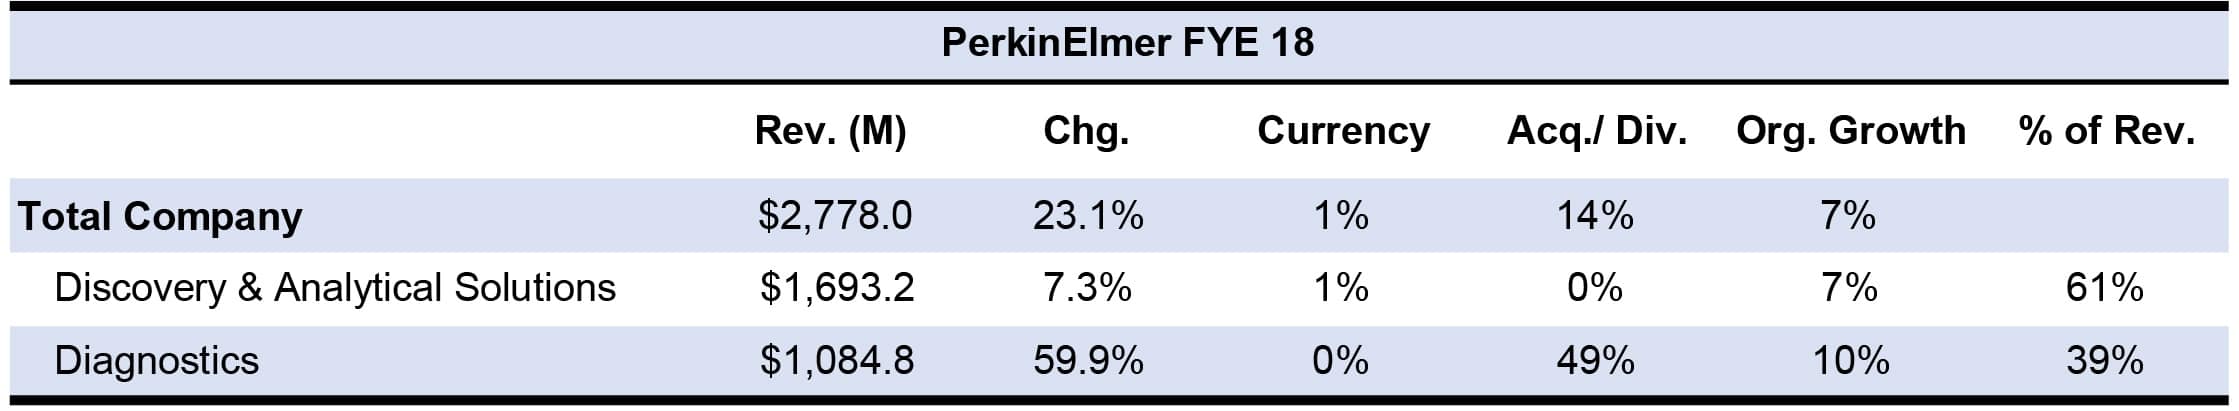
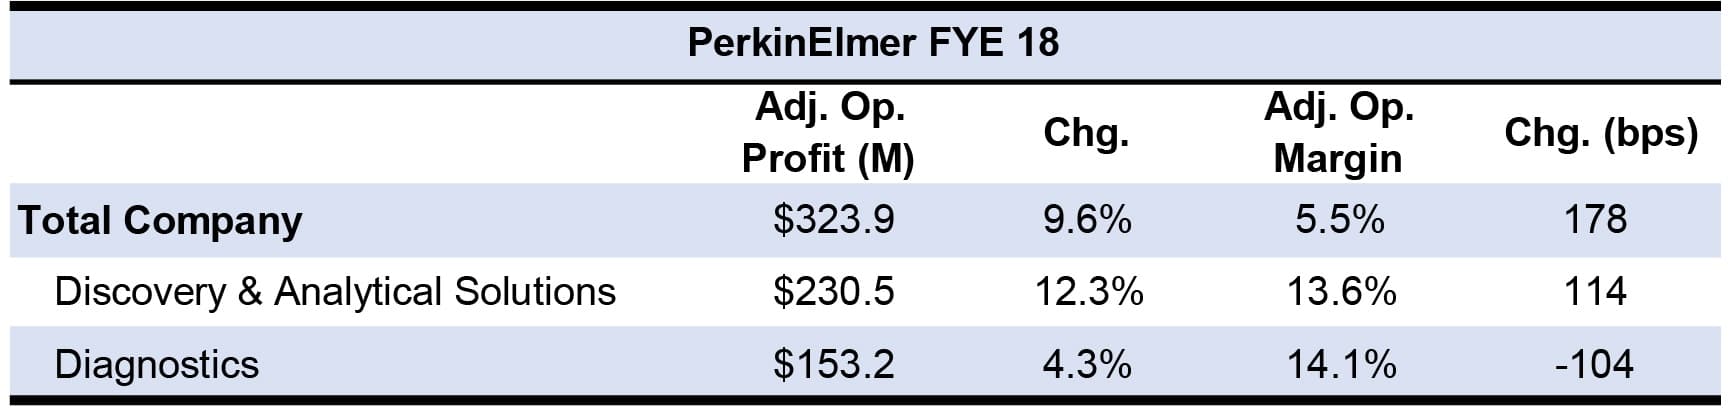
PerkinElmer’s full-year 2018 sales grew high single digits organically for the company as well as for the DAS division. Meanwhile, Diagnostics division sales grew in the double digits. Product and Service revenues rose 31.0% and 8.1% to make up 70% and 30% of sales, respectively. All figures below are given on an organic basis.
Click to enlarge
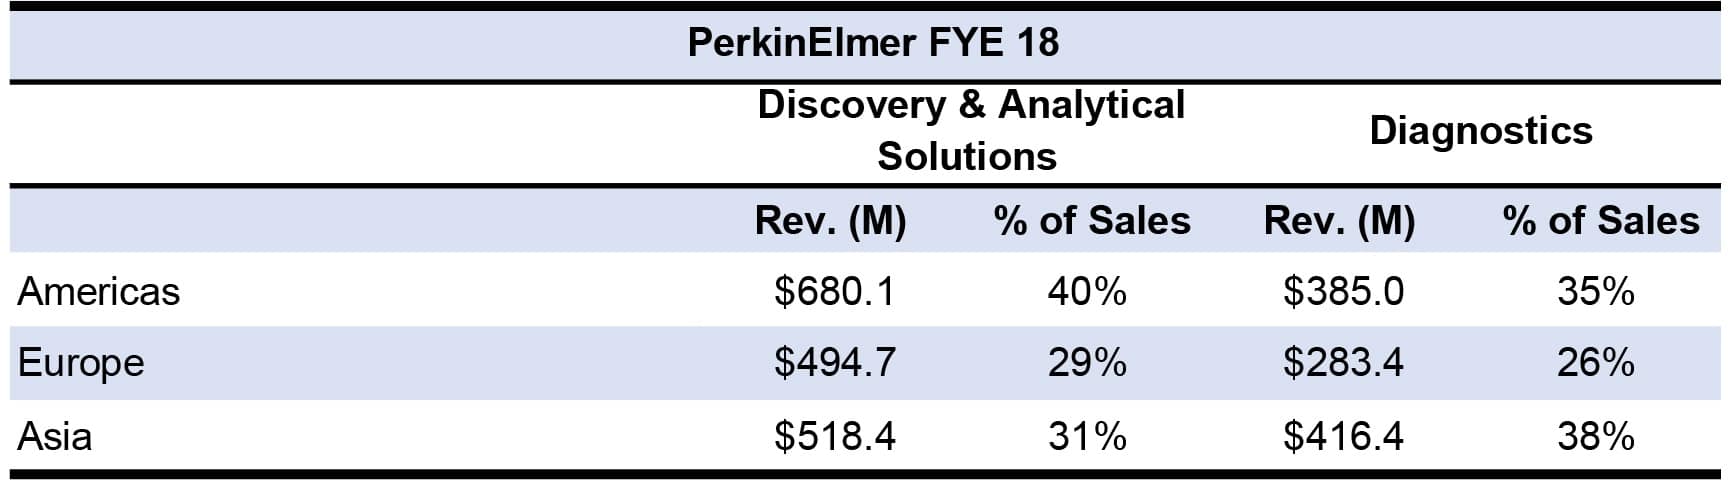
Geographically, the emerging markets regions accounted for 40% of total revenues, up from 28% in 2014. Products wise, consumables, services and software represented 70% of sales, up from 55% in 2014. The acquisition of Dani Analitica (see IBO 10/31/18), which expanded the company’s GC portfolio, and China-based Spectrum Instruments (see IBO 5/31/18) assisted in the change in geographical and product portfolios.
Click to enlarge
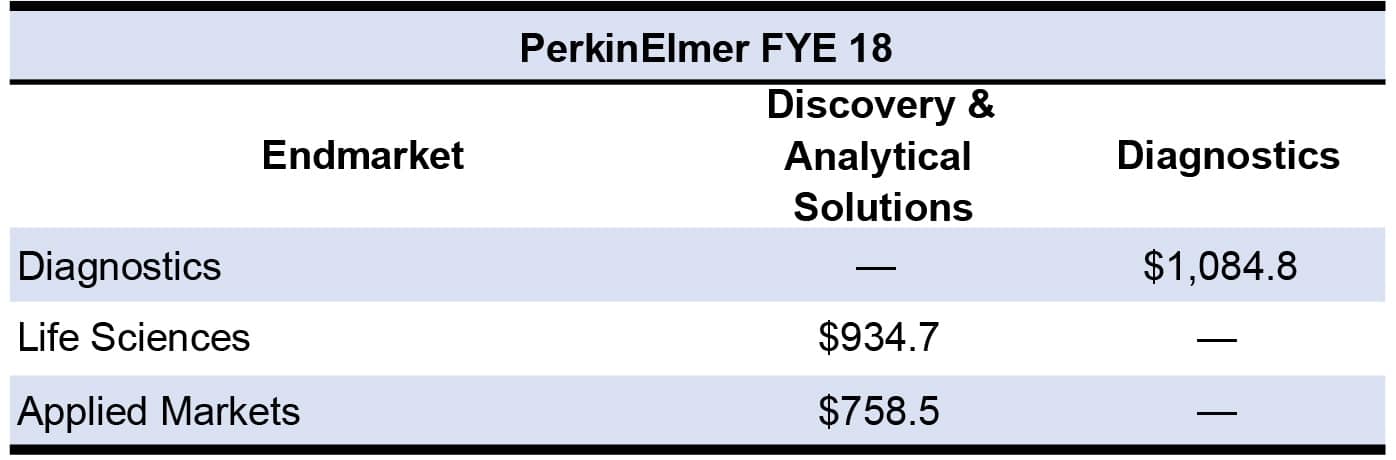
Market wise, the breakdown of total revenues shifted due to PerkinElmer executing specific business strategies in 2018. This included focusing R&D spending in genomics, infectious diseases and digital solutions; introducing new imaging reagents and software product lines for life science customers; and expanding the food analysis portfolio. As a result, 80% of the company’s revenues is in the diagnostics, food and life science markets, a 30-percentage point increase from 2014. This resulted in the environmental and industrial markets representing less than 20% of total revenues last year, a 25-percentage point decrease from 2014. Specifically, in the food analysis segment, PerkinElmer generated $200 million for 2018. In addition, the US experienced strong sales in the pharma/biotech market, especially sales in detection and imaging, and enterprise solution. In Diagnostics, the genomics testing business generated $10 million in sales.
Click to enlarge
Shimadzu AMI Orders Decrease in Japan
Shimadzu Analytical & Measuring Instruments’ (AMI) fiscal third quarter 2019 sales rose 5.2% to make up 61% of total company revenues (see Bottom Line). Orders for AMI products decreased 2.5% overall despite increased orders in all regions except Japan.
Click to enlarge
By product line, sales increased for all key models, defined as LC, MS and GC. Orders for key models grew 5%, excluding exchange rate effects. MS revenue growth was significant in food safety, environmental testing and clinical medicine markets. Geographically, LC and MS sales showed strength in North America, South America and Europe, but sales of both product lines in Japan decreased.
However, overall AMI sales in Japan increased, thanks to strong sales of testing machine and non-destructive inspection systems. India also experienced slow sales of LCs due to complications involving pharmaceutical regulations, especially those related to generic drugs. Environmental measurement instrument sales increased in China due to the government enforcing anti-pollution measures. As for GC, geographically, sales rose significantly in China, while MS sales in the country grew double digits.
Click to enlarge
By end-market, combined AMI sales to three main sectors were mixed. In the pharmaceuticals/contract analysis/healthcare/foods category, contract analysis sales grew globally, while pharma sales were strong in China and Europe. In the materials/machinery/electrical/automotive category, there was broad-based demand in many fields, especially petrochemical, steel and machinery. In the academia/government category, sluggish sales continued in Japan as well as globally. However, government demand increased to 41% of sales in China, in comparison to 45% in the previous quarter. AMI sales in the Other category increased due to the expansion of the analytical instrument customer base.
Click to enlarge
Sales outside of Japan represented 64% of AMI revenues. Geographically, North America sales rose 9.0% in local currency to ¥6.5 billion ($57.6 million at 112.76 = $1). South American sales remained flat in local currency at ¥1 billion ($8.9 million).
Click to enlarge
For fiscal year 2019, AMI’s sales growth forecast remains the same with a 9.4% increase bolstered by changes in currency effects.
Semiconductor and Pharmaceutical Lead Spectris Materials Analysis Sales
Click to enlarge
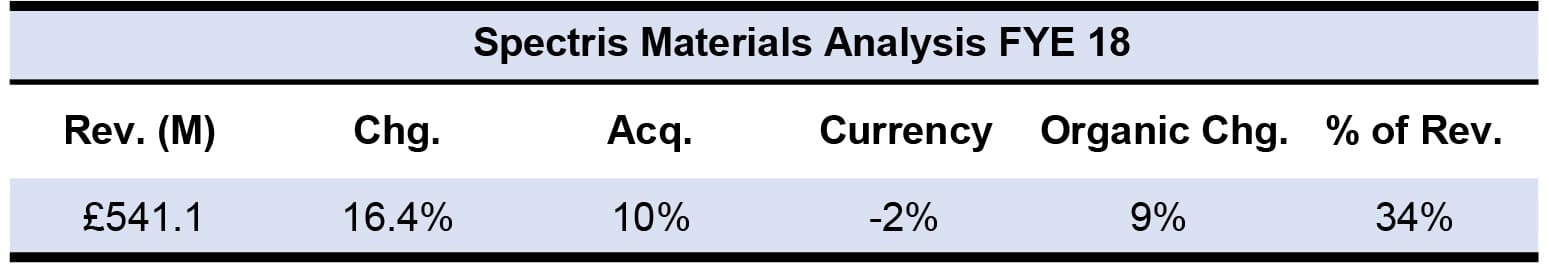
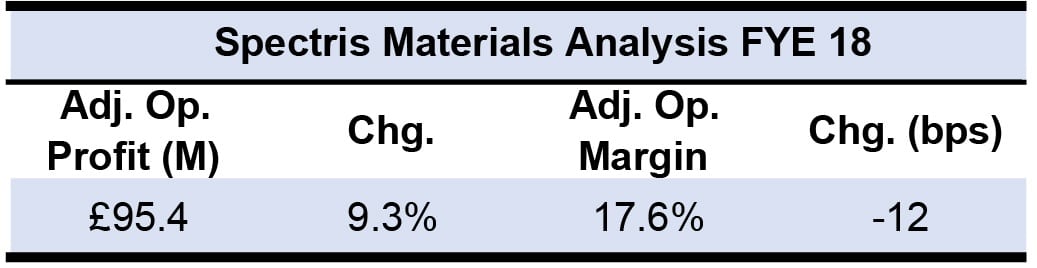
Spectris Materials Analysis (MA) revenue grew in the double digits in 2018 to make up 34% of company sales, thanks to strong demand in the semiconductor and pharmaceutical industries.
Click to enlarge
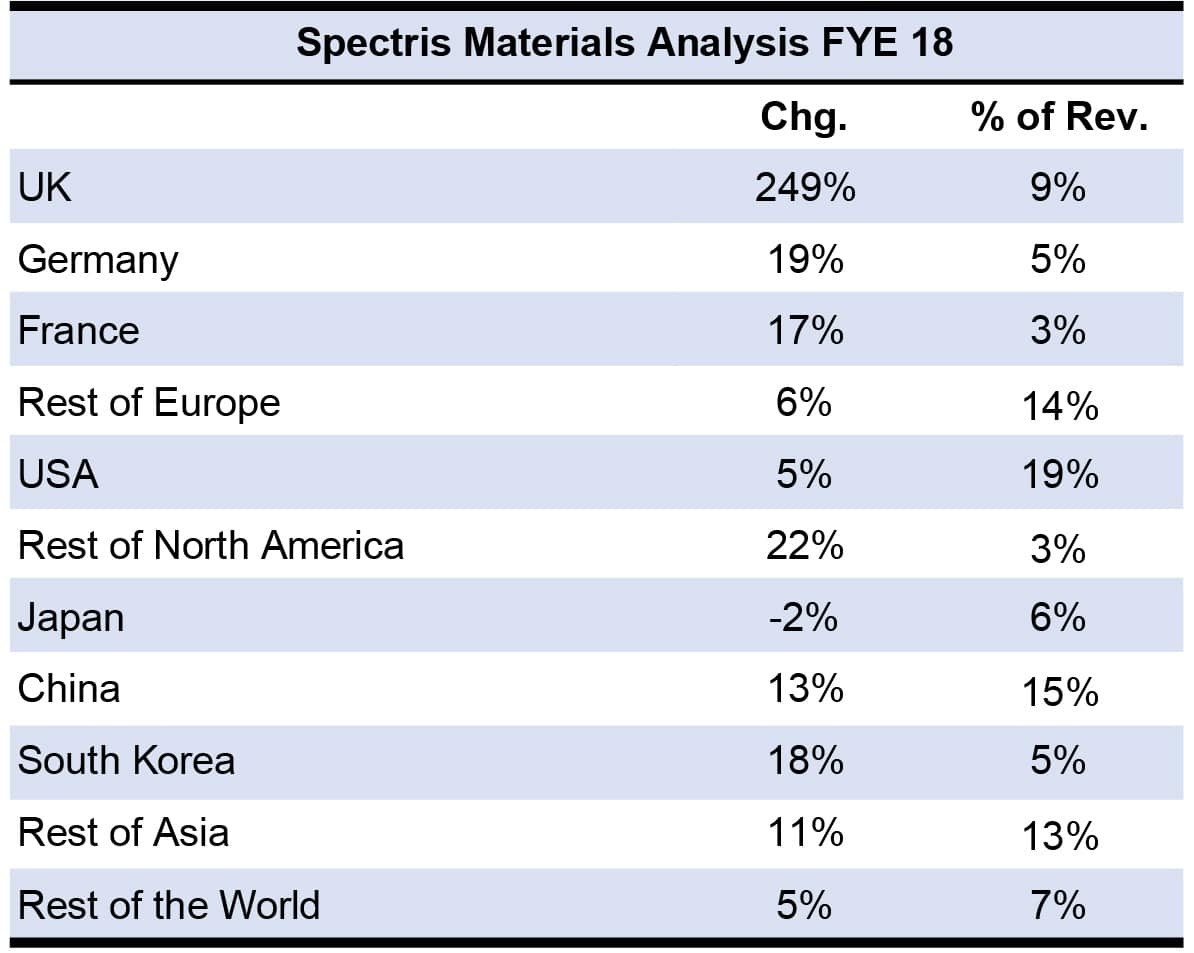
Geographically, there were strong MA sales in Asia, particularly China, South Korea and India. Most of the region’s revenue was generated in the second half of the year. In addition, North America and Europe sales were up, with most of the revenue generated in the first half of the year for both regions.
Click to enlarge
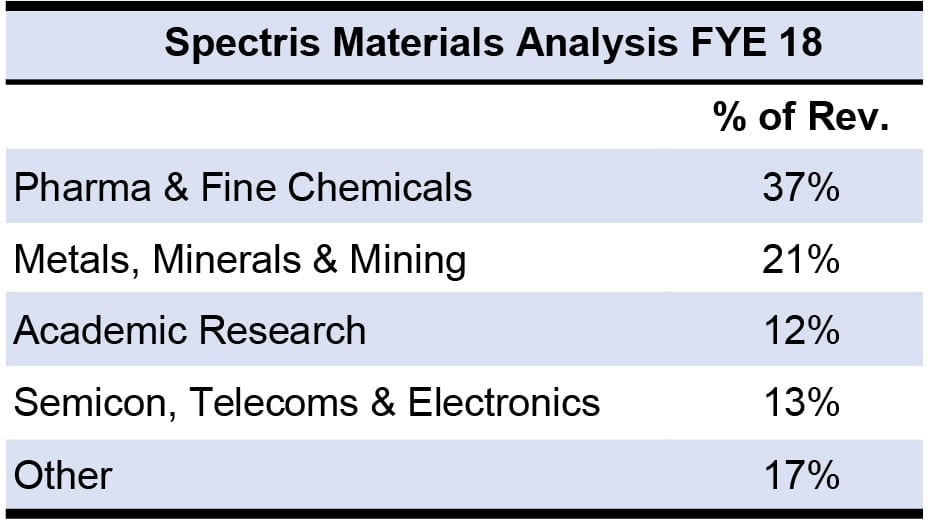
Spectris MA reported strong sales in the pharmaceutical/fine chemicals industry in North America, Europe and Asia. The company credited Asia’s strong regional sales to China and India, as both countries increased regulation of and investment in the pharmaceutical sector. The metals/minerals/mining industry generated solid sales but was flat in North America and Europe due to weak demand for metals. Sales in the academic research industry improved after a weak 2017, thanks to improved economic conditions and increased government funding in both North America and Asia. Lastly, the semiconductor/electronics industry saw strong demand from battery and electronic customers in China, Taiwan and South Korea.
Click to enlarge
Spectris did not provide a first quarter or a full-year forecast.
US and Asia Saves Waters from Soft Sales in Europe
Q4
Click to enlarge
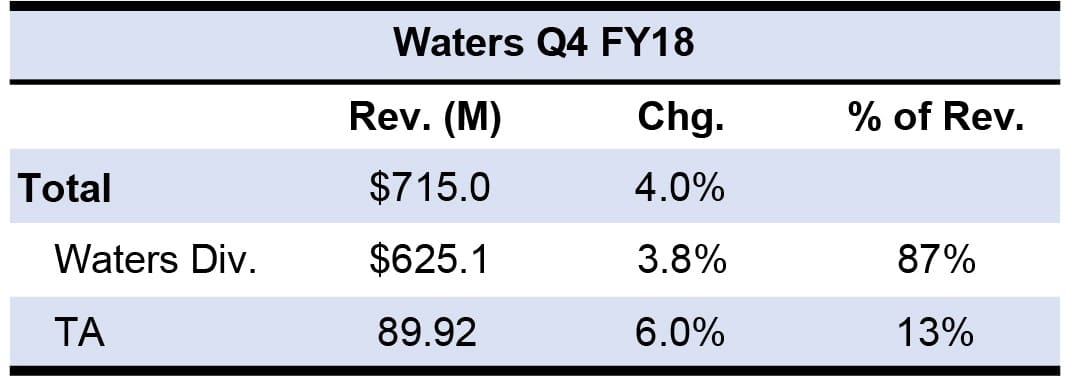
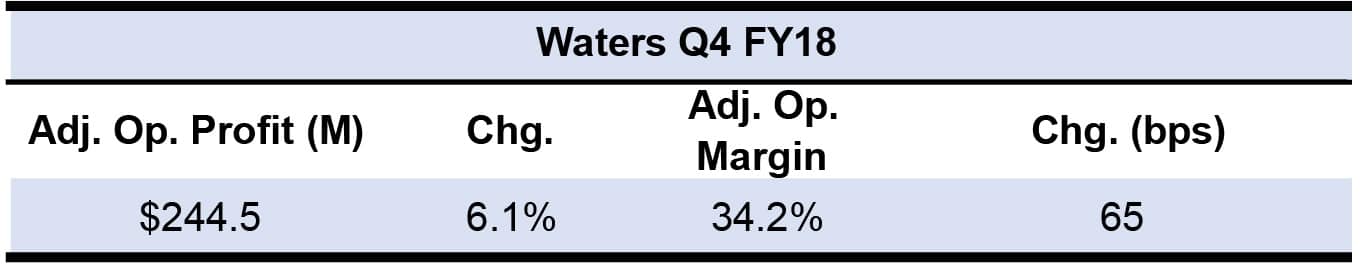
Waters’ fourth quarter 2018 revenues grew 5.0% in constant currency, as constant currency sales for the Waters Division and TA instruments increased 5.0% and 7.0%, respectively (see IBO 1/31/19). All figures below are in constant currency. Instruments led product line sales, rising 4%, followed by service and chemistry sales, increasing 6% and 8%, respectively. Overall sales were impacted by one additional calendar day in the quarter ,which slightly affected service revenue.
Click to enlarge
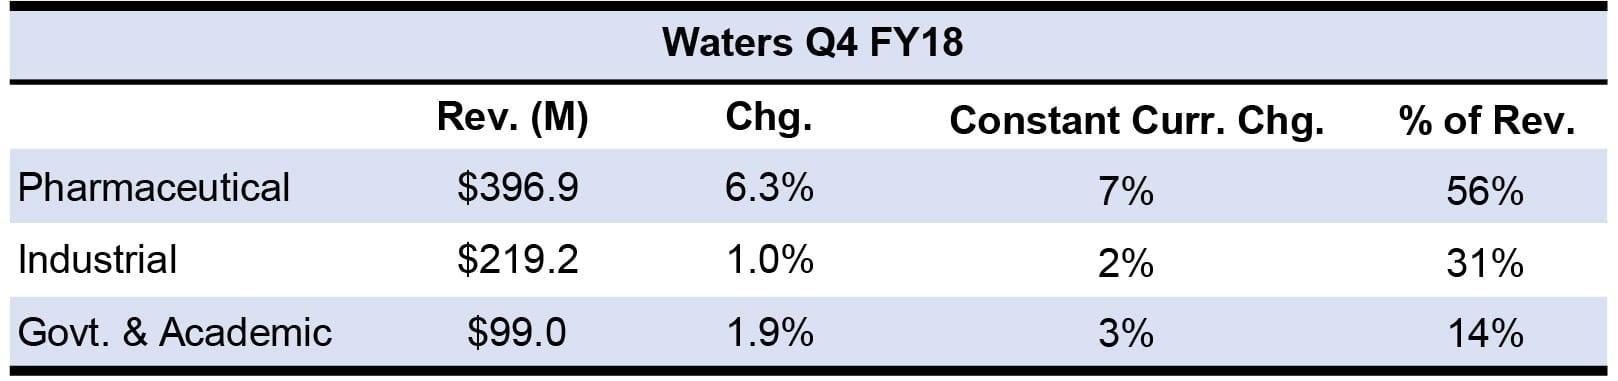
Waters experienced broad-based revenue growth in every market category, with particularly strength in the pharmaceutical market. The pharmceutical market’s performance was led by China’s double-digit revenue growth, which was partially offset by soft sales in Europe and India. Strong demand for material science products droves overall sales increases in the industrial market. The academic/government market’s revenue growth was led by both Asia and pharmaceutical discovery research. Geographically, Asian sales offset low sales in Europe and the Americas, while Asian pharmaceutical discovery research sales offset weak demand for biomedical research applications.
Click to enlarge
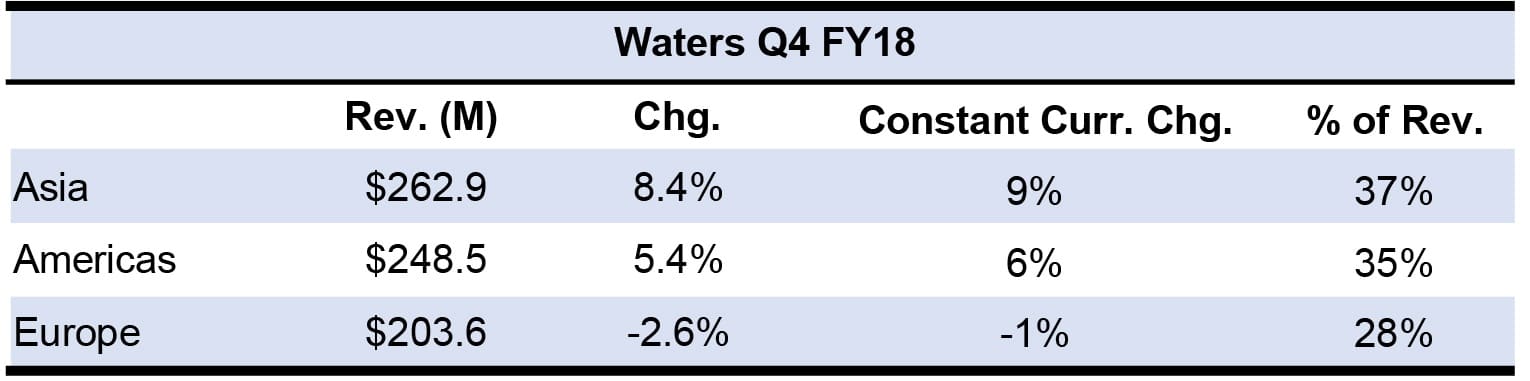
On a geographical basis, Chinese demand rose 15%, thanks to the pharmaceutical and academic/government markets, followed by solid sales in South Korea and Japan. Despite soft sales in India, the country achieved its second most profitable quarter in the company’s history due to strong demand in the pharmaceutical market.
Americas sales were driven by broad-based growth by market and product, primarily in the US, where revenue rose 5%. Though Europe had solid sales in the pharmaceutical market, and in Central and Southern Europe, the region was unable to offset overall soft sales due to socio-economic factors such as Brexit and low demand in both the industrial and government/academic markets.
Click to enlarge
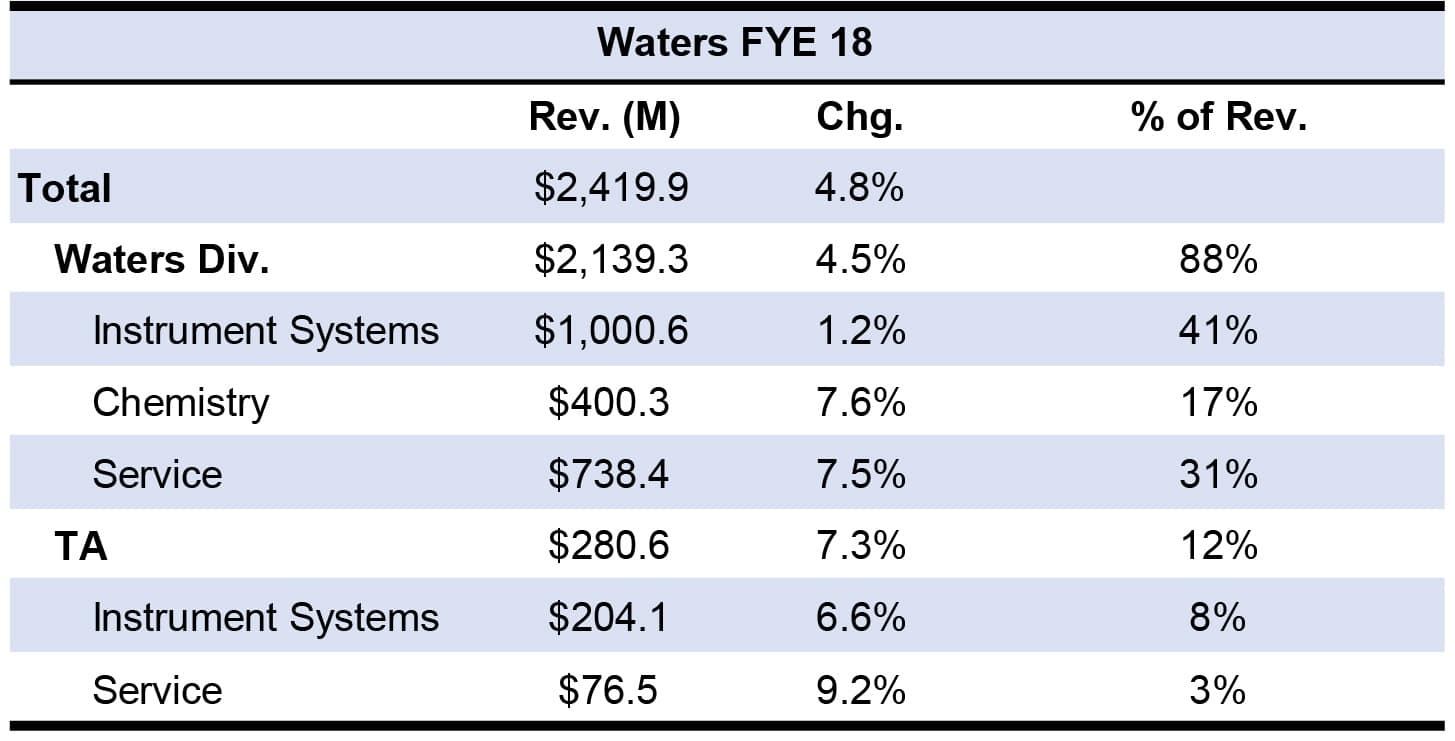
Product wise, Waters Division sales were driven by its chemistry product line, whose revenue increased 8%. LC and LC/MS instrument sales remained consistent with a 3% increase thanks to QA/AC demands in drug production. Demand for MS increased exponentially due to strong sales associated with the pharmaceutical market.
Demand for the TA-branded product line was due to instrument and service sales, which increased 6% and 9%, respectively. Thermal analyzer sales rebounded after soft sales in the previous quarter. Waters forecasts first quarter 2019 organic sales to increase a 4%–6%, with currency subtracting 2%–3% growth.
FYE
Click to enlarge
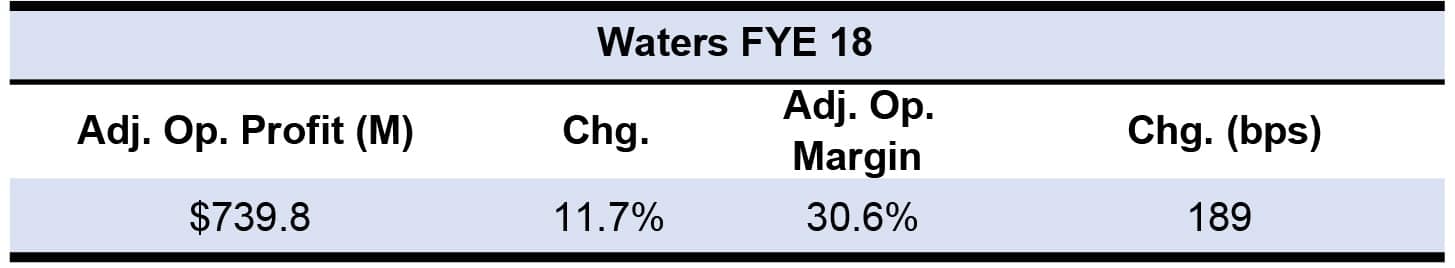
Waters’ full-year 2018 revenues grew 4.0% in constant currency, as sales for the Waters Division and TA Instruments increased 3.0% and 7.0%, respectively (see IBO 1/31/19). All figures below are in constant currency. Instrument sales rose 1.0%, and service and chemistry sales both rose 6.0%.
Click to enlarge
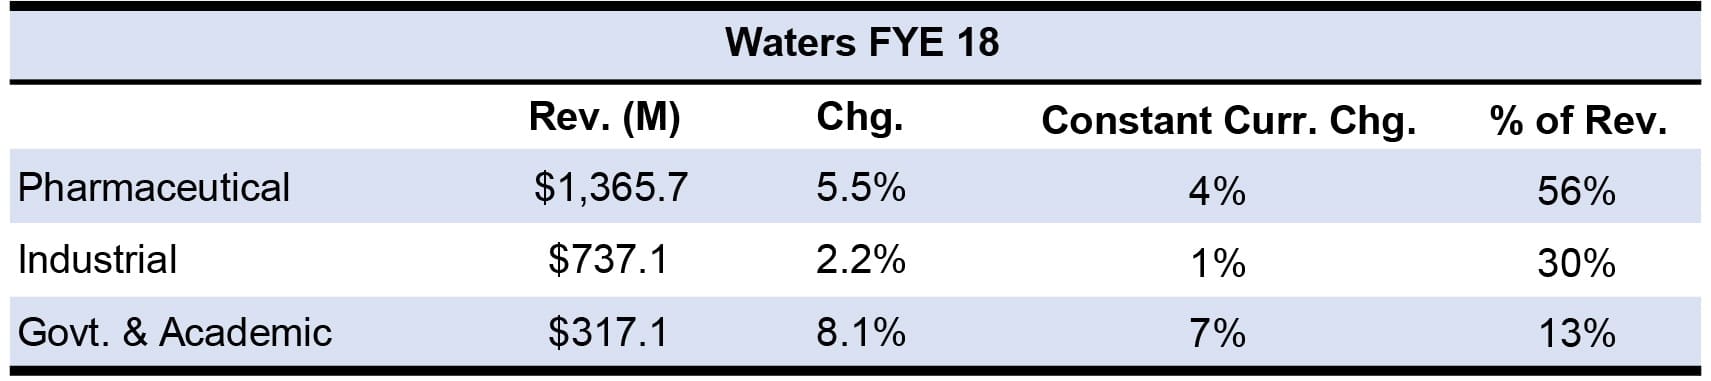
Waters’ 2018 overall sales were driven by the pharmaceutical market, specifically strong demand for both small molecule analysis and large molecule analysis, partially offset by soft sales to biomedical research customers. Specifically, small molecule analysis comprised two-thirds of the company’s pharmaceutical business, while one-third was related to biomolecular development.
Click to enlarge
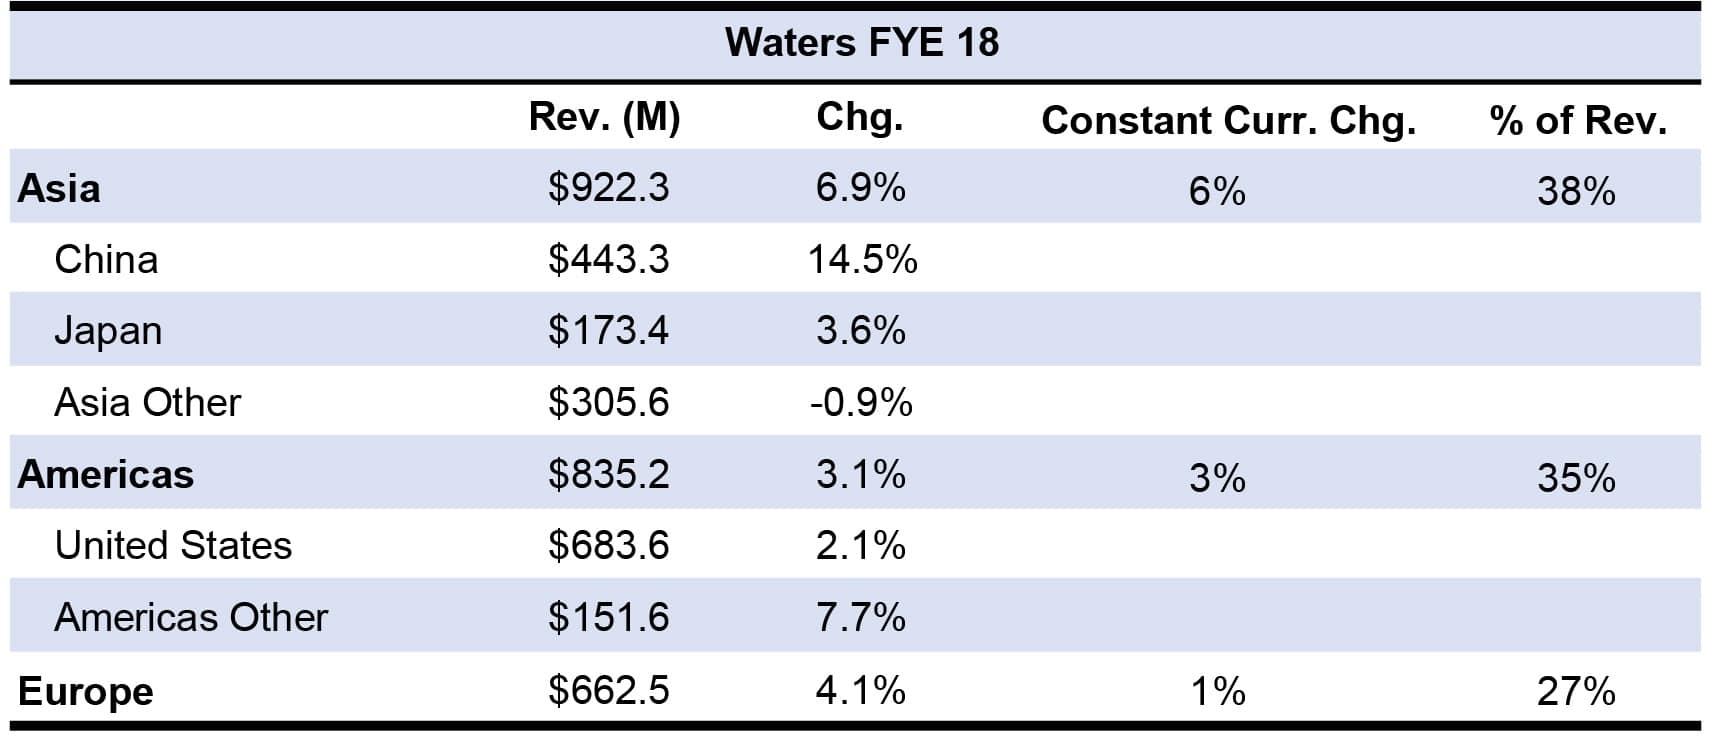
On a geographical basis, China’s double-digit growth was attributed to strong demand from the pharmaceutical and government/academic markets. Central and Southern Europe performed well for the year, but could not offset the soft sales in Northern Europe, as well as in the UK, Ireland and Benelux. Waters also noted its contingency plan regarding Brexit since 4% of its global revenues are from the UK.
Click to enlarge
Market wise, revenue growth in the academic/government market was largely driven by the US and Asia, but overall had soft sales due to Europe.
Waters expects its 2019 organic sales to increase 4%–6%, with currency subtracting 1%–2% growth.
