The Future of Materials Usage

Materials make up a significant sample set for analytical testing. For example, R&D is key to improving structural characteristics of construction materials and creating environmentally friendly sources of energy. QA/QC testing assures the integrity and proper processing of materials such as natural gas and cereals.
The OECD this week released a report on the future of materials, entitled “Global Material Resources Outlook to 2060.” The 61 material types that the report alludes to, including recycled materials, are divided into four categories: metals, fossil fuels, biomass and non-metallic minerals. The report presents a baseline scenario for materials consumption in 2060.
At 32%, nonmetallic metals accounted for the largest share of materials used last year. Biomass, the next largest, represented 24%. Together, these two categories account for over half of materials used in 2017. Fossil fuels made up 17% and metals accounted for 10%.
Changes in Overall Material Usage
The report specifically addresses changes in material usage over a 49-year period, from 2011–60. Material use is expected to increase 2.1x from 79 Gt in 2011 to 167 Gt in 2060. Factors behind this leap will be population growth and higher living standards, which will drive use of non-metallic materials and metals, especially in Asia and Africa. In addition, vehicles and electronics production will contribute to metals usage.
However, materials usage is expected to lag GDP growth over the same period. In the report, this change is measured by “materials intensity,” the ratio of materials consumption to GDP. Global materials intensity was estimated to be -1.1% annually on average over the past 37 years versus an estimated average of -1.3% from 2017 to 2060. Contributors to this change include the worldwide transition from manufacturing- and agriculture-based economies to service-based economies.
Usage by Category of Material
Macroeconomic transitions are expected to affect the use of each type of material differently. Metals usage lead the growth projections for 2011-60, followed by nonmetallic materials usage (which includes construction materials) due to construction, vehicle and electronics production (see graph below).
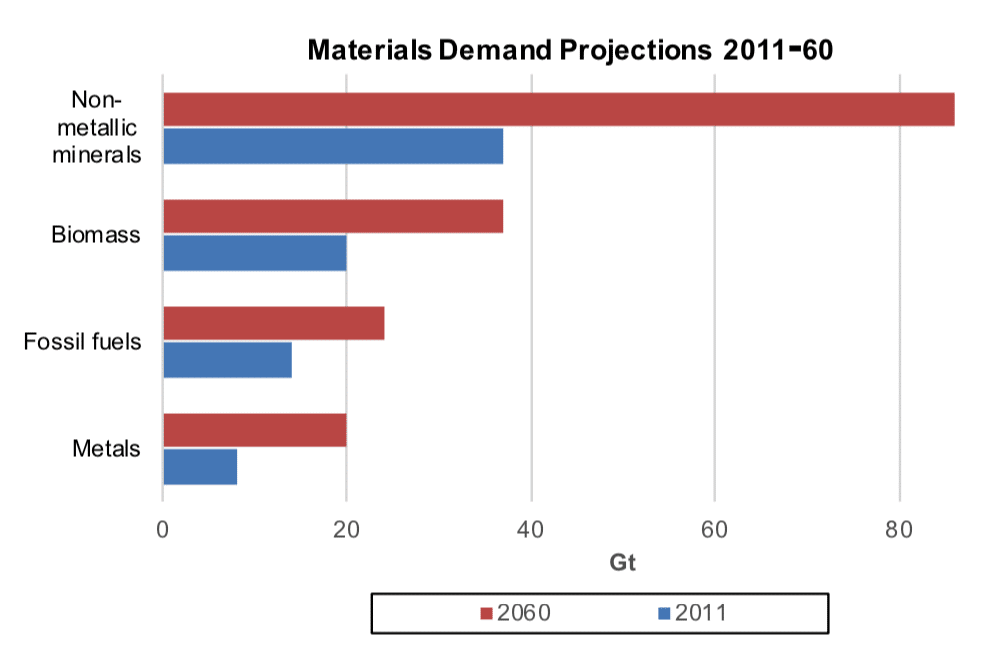
Source: OECD
Click to enlarge
The two largest subcategories of materials use measured by material intensity, construction and food, will remain identical in both 2011 and 2060. Construction materials include sand gravel and crushed rock. But electricity and utilities will displace iron and steel as the third largest category in terms of material intensity over the period. Measured in terms of total output from 2011 to 2060, textiles, motor vehicles and electronics are expected to grow the fastest.
Although materials recycling will increase over the projected period, it will not be able to keep up with materials demand. In addition, materials recycling is expensive in terms of labor costs for production, discouraging faster growth.
Usage by Region
By region, the faster growth for materials usage from 2017 to 2060 will be demand for fossil fuels and metals in Rest of World, following by BRIICS and the OECD. However, for biomass and non-metallic materials, the OECD will be second followed by the BRIICS (see table below).
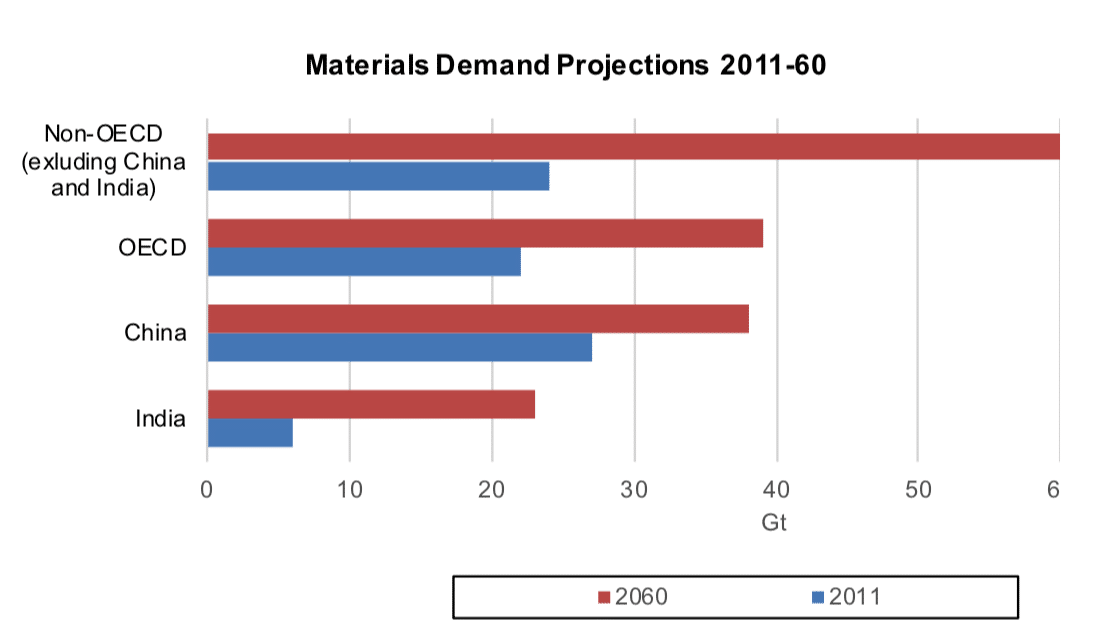
Source: OECD
Click to enlarge
Measured by materials intensity, material usage will decline in all major regions (OECD America, OECD Europe, OECD Pacific, Eurasia, Other Asia, Other America, and the Middle East and Africa) from 2011 to 2060. The largest decline will be in Eurasia, with a drop from 0.9% to 0.5% and Other America, with a decline from 0.8% to 0.4%.

