Fourth Quarter 2017 Results: Fluidigm, HORIBA, Merck KGaA, NanoString, Pacific Biosciences
Double-Digit Growth for Fluidigm in Fourth Quarter 2017
Q4 2017
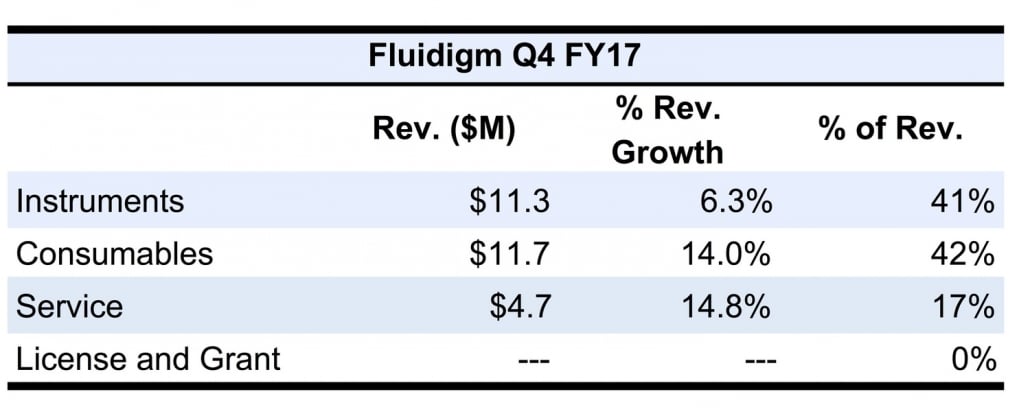
Fourth quarter 2017 sales for Fluidigm advanced 10.6%, driven by strength in mass cytometry and high-throughput genomics products. Strong sales for the quarter were partially offset by declining single-cell genomics sales. Research customers accounted for approximately 64% of total sales, while applied customers represented 36%.
Instrument sales rose 6.3% to $11.3 million, supported by strong mass cytometry revenue. High-throughput genomics instruments revenue also contributed to segment growth. However, weak single-cell genomics instruments sales partially offset the growth.
Consumables sales increased 14.0% to $11.7 million, heavily driven by mass cytometry consumables and high-throughput genomics sales. Service revenue also performed well, up 14.8% to $4.7 million. Service sales were strong due to higher mass cytometry instrument sales.
Total product revenue amounted to $23.0 million. Genomics product revenue fell just 0.8% to $12.3 million, mostly due to decreased single-cell genomics sales. Mass cytometry product sales, however, advanced 25.6% to $10.8 million, driven by both instrument and consumables sales.
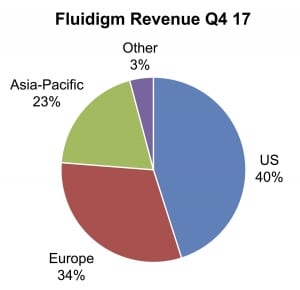
Geographically, fourth quarter 2017 sales in the US fell 15% to $11.2 million. The decrease in US sales were primarily due to lower mass cytometry and single-cell genomics sales. As for sales in Europe and Asia Pacific, sales advanced 41% and 29% to $9.5 million and $6.3 million, respectively. Both regions’ strong performance was primarily driven by increased demand for mass cytometry products.
FY 2017
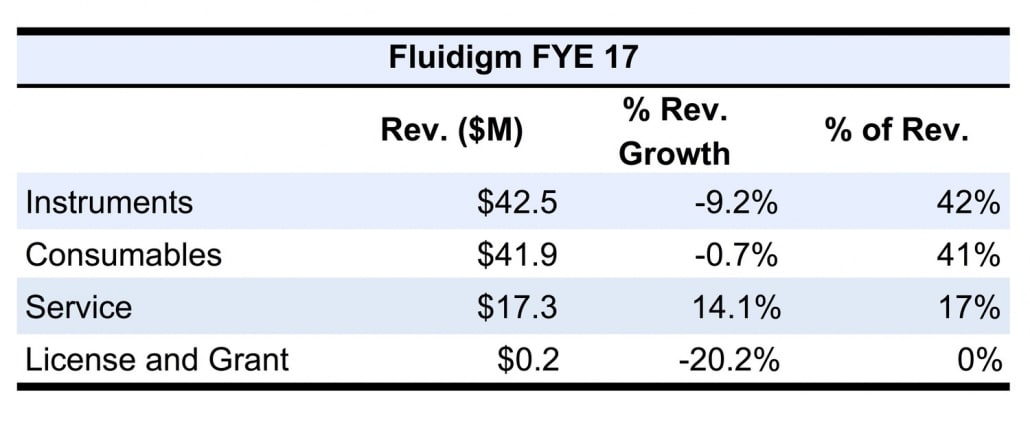
Sales for the year fell 2.4% to $101.9 million, primarily lowered by weak single-cell genomics sales.
Instrument sales decreased 9.2% to $46.8 million, as a result of lower-than-expected genomics instrument sales. However, mass cytometry sales were strong, partially offsetting the decrease.
Consumables revenue slid 0.7% to $41.9 million due to weak genomics consumables sales. However, sales of mass cytometry consumables continued its strong growth. Service sales grew double-digits for the year, up 14.1% to $17.4 million, driven by increased service contracts.
Product revenue totaled $84.4 million, with mass cytometry product sales up 38.0%. Mass cytometry sales for the year amounted to $39.6 million, driven by both instrument and consumables revenues. However, genomics product sales fell 25.7% to $44.8 million due to decreased demand for single-cell genomics products.
Geographically, sales in the US fell 13.0% to $45.8 million, accounting for 45% of total company sales. US sales were lower due to weak single-cell genomics revenue. European sales represented 32% of total company sales at $32.6 million, an increase of 9.8%. Sales in the Asia Pacific also grew high-single digits, up 8.3% to account for 20% of total sales. Sales in all other regions of the world represented 3% of total sales.
For the first quarter of 2018, sales are expected to remain flat, between $24 million and $27 million.
HORIBA Instrument Revenues Remain Steady into Fourth Quarter
Q4 2017
Fourth quarter 2017 sales for HORIBA’s Scientific Instruments & Systems segment (SI) climbed 9.6% to ¥8,343.0 million ($78.5 million at ¥106 = $1), representing 13% of total company sales.
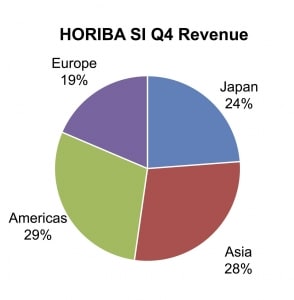
Geographically, SI sales in Asia grew the fastest, up 52.7% to ¥2,374.0 million ($22.3 million). Sales in the Americas also advanced double digits, rising 13.7% to ¥2,433.0 million ($22.9 million). Sales for the regions accounted for 28% and 29% of segment revenue, respectively. In Japan and the European region, sales decreased, down 1.9% and 18.0%, respectively.
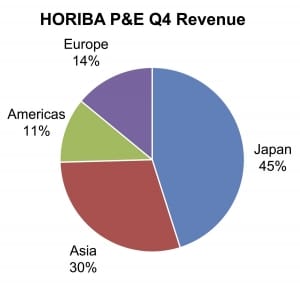
Sales for HORIBA’s Process & Environmental Instruments & Systems segment (P&E) rose 9.2% to ¥5,398.0 million ($50.8 million). P&E sales accounted for 9% of total company sales for the quarter.
Geographically, P&E sales in Japan skid 4.0% to ¥2,434.0 million ($22.9 million); however, they still represented the largest portion of sales at 45%. Sales in Asia accounted for 30% of segment revenue, with sales of ¥1,591.0 million ($14.9 million). Asian P&E sales advanced 31.2%. Sales in the Americas and in the European region both grew double digits, up 12.8% and 16.6%, respectively. Sales in the Americas represented 11% of segment sales, while European sales accounted for 14% of segment sales.
FY 2017
2017 sales for HORIBA’s SI segment slid 1.5% to ¥26,117.0 million ($245.8 million), primarily affected by slow sales in Japan and Europe. Segment operating income dropped 47.2% to ¥498.0 million ($4.7 million) due to a large increase in R&D expenses.
Geographically, SI sales in Japan fell double digits, down 13.8% to ¥6,471.0 million ($60.9 million), making up 25% of segment revenue. Conversely, sales in Asia and the Americas both rose double digits, up 20.2% and 10.4%, respectively. Asian sales amounted to ¥7,312.0 million ($68.8 million), while sales in the Americas totaled ¥7,244.0 million ($68.2 million). Both regions accounted for 28% of segment sales. European sales slid 8.9% to ¥5,088.0 million ($47.9 million), representing 19% of segment revenue.
In contrast, sales for HORIBA’s P&E segment increased 4.1% to ¥17,433.0 million ($164.0 million). The solid sales growth was primarily supported by strong stack gas analyzers revenue, partially offset by weak process-measurement equipment sales. Operating income for the segment fell 29.0% to ¥1,094.0 million ($10.3 million) due to the low process-measurement equipment sales.
Geographically, P&E sales in Japan rose moderately, up 3.5% to ¥9,387.0 million ($88.3 million). The increase in Japanese sales was driven by healthier consumer spending, along with an overall robust economic recovery trend. Japanese sales represented 54% of segment revenues. Sales in the Asia Pacific advanced the fastest, leaping 38.0% to ¥3,792.0 million ($35.7 million). The accelerating sales growth was primarily driven by China’s economy and supported by various government policies. Asia Pacific sales accounted for 22% of segment revenue. Sales in Europe also performed well, up 9.6% to ¥2,194.0 million ($20.7 million), despite looming uncertainties over policies. Sales in the Americas, however, dove 30.0% to ¥2,058.0 million ($19.4 million), now accounting for just 12% of segment sales.
For the full-year 2018, HORIBA expects its entire sales to increase by ¥14,600 million ($137.4 million), or 7.5%, to ¥210,000.0 million ($1,976.1 million). As for its total operating income, the company projects an increase of 8.1% to ¥29,000.0 million ($272.9 million).
Process Solutions Drive Merck KGaA Life Science
Q4 2017
Merck KGaA’s Life Science segment (LS) delivered fourth quarter 2017 sales of €1,496.2 million ($1,850.4 million at €0.81 = $1), an increase of 3.8%, driven by solid Process Solutions sales. Currency effects unfavorably impacted sales growth by 5.5%, while acquisitions added 0.4%. Organic sales for the quarter grew 8.9%.
Process Solutions sales advanced 8.5% to €579.2 million ($716.3 million), accounting for 39% of LS sales. Organically, sales grew 14.4%, driven by increased demand for single-use products.
Research Solutions revenue dipped 0.4% to €510.8 million ($631.7 million), making up 34% of total LS sales. Organically, sales rose 5.2%, supported by strong eCommerce business sales.
Applied Solutions sales grew 3.0%, 6.2% organically, to €406.2 million ($502.4 million). The strong organic growth was driven by an overall increase in demand from all regions and businesses.
Geographically, LS sales in Europe grew 5.0% to €527.7 million ($652.6 million), for which currency effects adversely impacted growth by 0.8%. Acquisitions added 0.3% to sales growth. Organic sales growth for the region amounted to 5.5%. European sales for the quarter represented 35% of LS sales. Also accounting for 35% of LS sales was North America. Sales for the region advanced 2.3% to €517.7 million ($640.3 million). Organically North American sales rose 10.7%.
Sales in the Asia Pacific also grew double digits organically, rising 10.5% to €361.0 million ($446.5 million). Currency effects and acquisitions both negatively affected sales by 6.1% and 0.3%, respectively. Reported sales for the quarter grew 4.2%. Latin American sales fell 1.6% to €63.1 million ($78.0 million); however, sales for the region were up 6.5% organically. In the Middle East & Africa region (MEA), both reported and organic sales soared, up 23.4% and 24.8%, respectively.
FY 2017
Full-year 2017 sales for Merck KGaA LS rose 4.0% to €5,881.4 million ($7,273.6 million). Organically, sales rose 5.3%, driven by high single-digit organic sales growth for Process Solutions.
Sales for the Process Solutions business increased 6.0% to €2,240.7 million ($2,771.1 million), making up 38% of LS sales. Organically, sales were up 8.1% for the year, driven by increased overall demand, along with rising production of large molecules. Additionally, sales to the pharmaceutical market also contributed to Process Solutions revenue growth. Over the course of 2017, Process Solutions sales were slow for the first half of the year, then accelerated towards the end of the year.
Research Solutions sales climbed slightly, up 1.0%, 2.9% organically, to €2,066.0 million ($2,555.1 million). Sales were mostly driven by Lab & Specialty Chemicals sales. Research Solutions revenue for the year accounted for 35% of LS sales.
Applied Solutions revenue for the year grew 5.1% to €1,574.7 million ($1,947.5 million), driven by biomonitoring products. Currency effects negatively impacted sales by 1.6%, while acquisitions pushed sales up by 1.9%. Organically, sales rose 4.8%, primarily propelled by demand for analytical testing products.
Geographically, North American LS sales grew 3.0% to €2,092.6 million ($2,587.9 million), accounting for the largest portion of segment sales at 36%. North American sales advanced 4.5% organically, driven by a 6.7% increase in Process Solutions demand. Research Solutions sales grew 2.7% for the region, driven by increased customer demand and contributions from the Sigma-Aldrich acquisition (see IBO 11/30/15). Applied solutions also added to the region’s sales, with its sales increasing 3.4% due to strong demand in Analytics and Biomonitoring.
Sales in the European region also delivered healthy growth, up 3.2% to €2,022.5 million ($2,501.3 million). Organically European sales rose 3.9%, driven by strength in Process and Research Solutions. Overall, the region experienced positive growth across most of the portfolio.
Asia Pacific sales advanced 5.4%, 8.2% organically, to €1,395.4 million ($1,725.7 million). APAC sales were driven by Process Solutions sales. Upstream & Systems and Filtration & Chromatography sales contributed to the strong organic growth.
For the full-year 2018, Merck KGaA expects organic growth to be above market level, over 4%, with Process Solutions continuing its expansion.
Strong Finish for NanoString
Q4 2017
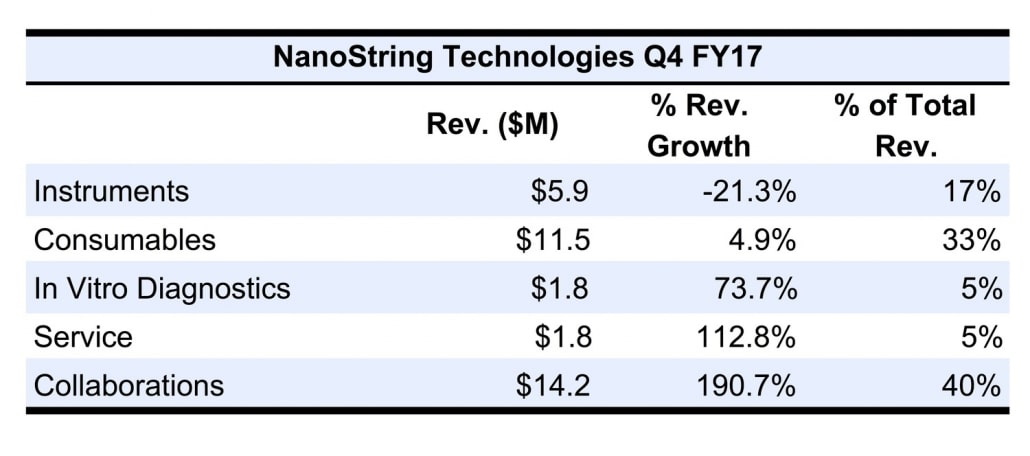
NanoString Technologies’ total sales for the quarter totaled $35.2 million, an increase of 39.6%. Products and services revenues, however, rose just 3.3% to $21.0 million. Products and services sales were driven by solid consumables sales, partially offset by weak instrument sales.
Instruments sales fell 21.3% to $5.9 million, but were up sequentially by 33%. Instrument sales experienced a tough comparison during the quarter, yet showed signs of recovery as SPRINT placements were up 30%. Instrument revenue accounted for 17% of total sales. Service revenue increased significantly, up more than double from the prior period to $1.8 million, driven by strength in the Digital Spatial Profiling (DSP) technology access program.
Collaborations revenue also delivered significant growth, up $9.3 million to $14.2 million. The strong growth in collaboration sales was derived from accelerated revenue from the Merck collaboration, along with the agreement with Lam Research (see IBO 8/15/17).
Consumables sales, excluding In Vitro Diagnostics (IVD) revenue, climbed 4.9% to $11.5 million. IVD sales for the quarter advanced 73.7% to $1.8 million. Total consumables sales recorded a 10.8% gain to $13.3 million.
FY 2017
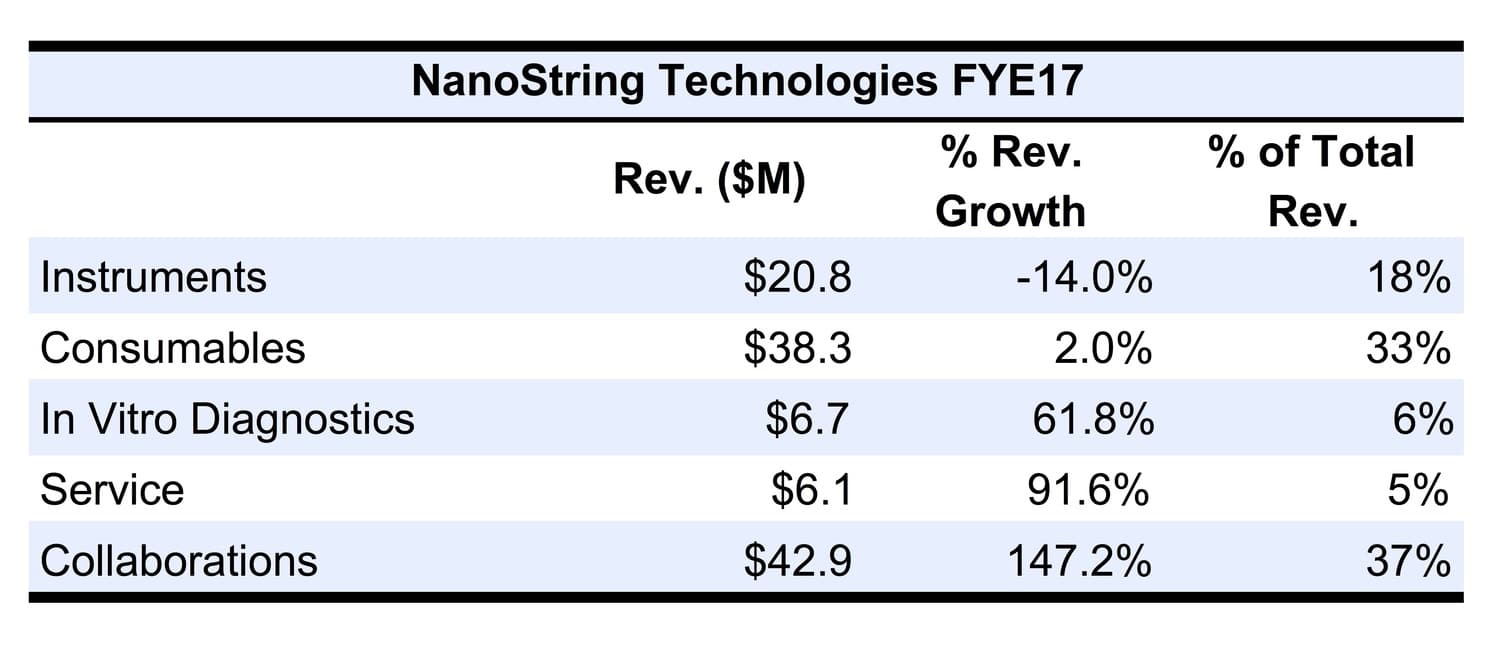
NanoString sales for the year advanced 32.9% to $114.9 million, driven by consumables and services. Product and service sales rose 4.2% to $72.01, with growth partially offset by decreased Instruments sales.
Instrument revenue fell 14.0% to $20.8 million for the year, driven down due to fewer instruments sold, along with lower average prices. A majority of instruments sold during the year were done so through distributors, resulting in the lower selling prices. In 2017, around 125 instruments were sold, a decline versus prior year’s 140 instruments.
Service sales rose nearly double to $6.1 million, primarily driven by increased revenue through technology access fees, along with the number of instruments covered by service contracts.
Collaborations revenue also grew significantly for the year, up $25.5 million to $42.9 million, driven by the Merck and Lam collaborations.
Consumables revenue, excluding IVD sales, climbed 2.0%, supported by solid growth related to nCounter Analysis systems. IVD sales increased 61.8% to $6.7 million, driven by increased testing volumes. Total consumables revenue rose 8.0% to $45.1 million.
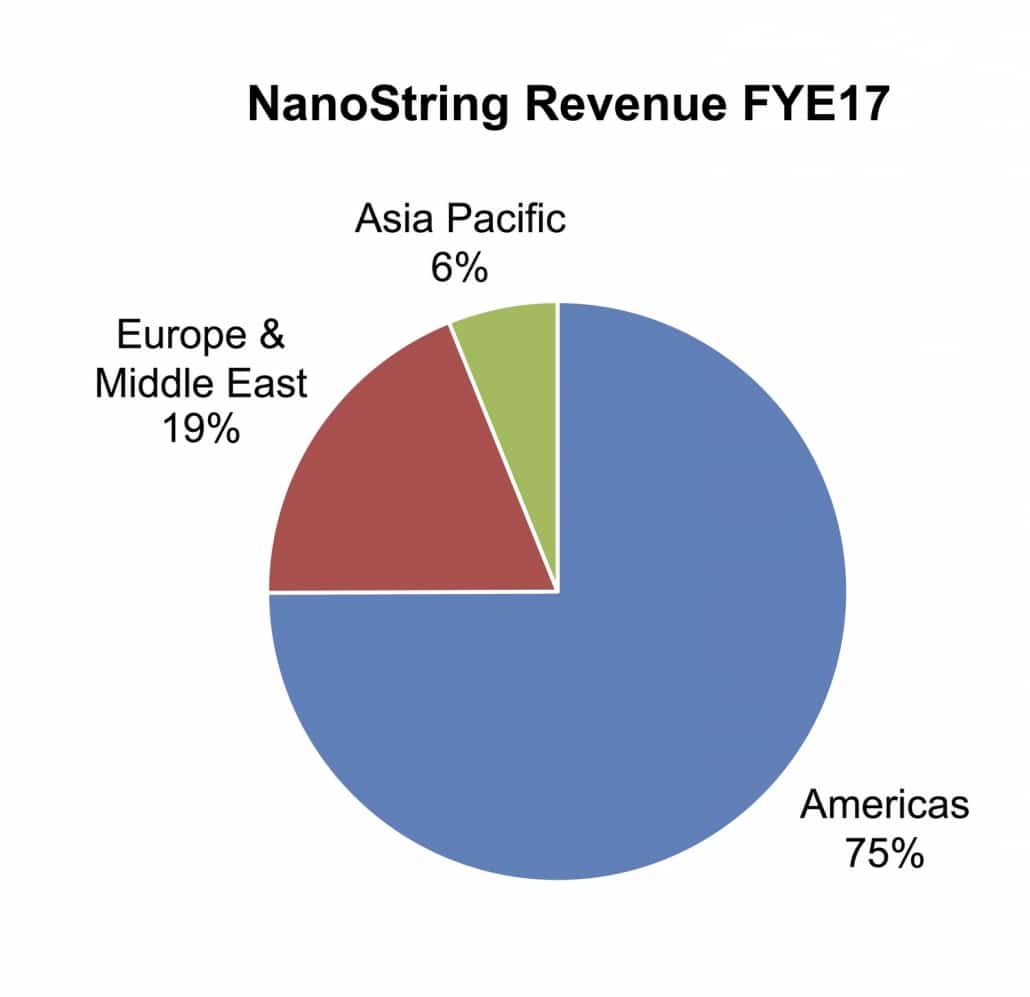
Geographically, sales in the Americas grew the fastest, climbing 42.7% to $86.1 million. Sales for the region accounted for 75% of total company sales. Revenue in the EMEA region also delivered growth, advancing 17.8% to $21.8 million, accounting for 19% of company sales. Asia Pacific revenue, however, fell 8.4% to $7.0 million.
For the first quarter of 2018, NanoString expects products and service revenue to be between $16 million and $17 million, an increase of 4.4% on a mid-point basis. As for the full year, the company expects total revenue to be $100–$105 million, and its products and service sales to be $75–$80 million. This represents a decrease of 10.8% and 7.1% on a mid-point basis, respectively. Additionally, NanoString projects IVD sales to be $8–$9 million, while its collaboration revenue is expected to be $25 million.
Consumables Lift Pacific Biosciences’ Product Growth
Q4 2017
Fourth quarter sales for Pacific Biosciences fell 3.1% to $24.9 million. Excluding contractual revenue, sales rose 2.3%, driven by Product revenue. During fourth quarter of 2016, Pacific Biosciences recorded $1.3 million of contractual revenue, as part of the Roche agreement.
Product sales advanced 6.1% to $21.8 million for the quarter, heavily driven by consumables revenue. Consumables sales for the quarter vaulted 69.3% to $12.7 million, while instrument sales plunged 29.8% to $9.1 million. The strong consumables sales signifies an eighth consecutive quarter of consumables growth. Consumables sales accounted for 58% of Product sales, while instrument sales represented 42% of segment sales.
Service and Other revenue decreased 18.3% to $3.1 million, now accounting for just 12% of total company revenue.
FY 2017
Total revenue for the year increased 3.0% to $93.5 million. Excluding contractual revenue, sales jumped 18.9% with strong Product sales. In 2016, Pacific Biosciences benefited $12.1 million from contractual revenue due to the Roche agreement.
Product revenue leaped 23.9% to $80.0 million for the full year, driven by strong consumables sales. Consumables sales rose 74.7% to $41.4 million, driven by increased utilization on a rising installed number of Sequel systems. Instrument sales, however, decreased 5.8% to $38.6 million, primarily due to a large backlog of Sequel orders in late 2016 and early 2017. The company finished the year with over 370 PacBio systems.
Service and Other revenue slid 3.8% for the year, dropping down to $13.4 million. Service and Other revenues represented 14% of total company sales.
Geographically, sales in China accounted for 30% of total company sales. On another note, during the middle of first quarter 2018, many systems and businesses will halt due to Chinese New Years celebrations. As a result, Pacific Biosciences expects first quarter revenue to be sequentially lower than fourth quarter 2017 revenues, primarily due to a slowdown of sales in China. As for the full year, the company expects an increase of 20% to $112.0 million.

