China and US in the Lead: Science and Engineering Publications 2007–17

Capturing the attention of policy makers and companies serving the academic research market, including scientific instrument and lab product providers, the countries with the largest number of science and engineering (S&E) articles has significantly evolved between 2007 and 2017. China leads the list in 2017 followed by the US, a reverse from 2007, according to a May report from the NSF’s National Center for Science and Engineering Statistics.
The calculations are based on the number of science and engineering articles during that period that make up the Scopus database of scientific publications, as well as figures from the nonprofit SRI International, a research institute, and Science-Metrix, an Elsevier-owned company that evaluates scientific activities. Scopus’ publisher Elsevier calls the database “the largest abstract and citation database of peer-reviewed literature: scientific journals, books and conference proceedings.” The country assigned is based on the address of the author’s institution, with a fractional count used to classify articles with authors from different countries. The average annual growth rate for S&E publications worldwide was 4.0% between 2007 and 2017.
Source: NSF
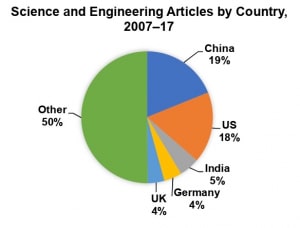
Of the 1.7 million S&E articles published in 2017, exactly half originated in five countries, led by China (see chart). However, if EU countries are taken as a whole, the EU accounted for the largest number of publications at 26.0%. Finishing out the top 10 were Japan, Italy, Russia, France and South Korea.
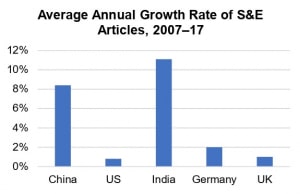
Only 1 country among the top 5, India, recorded a double-digit percentage increase in the number of S&E publications over the decade at 11.1% (see chart). But the fastest growth rate among all countries with over 45,000 S&E publications in 2017 belonged to Iran at 15.3%, with India following. In contrast, 1 of the top 5 countries was among the slowest growing during that period. US publications increased only 0.8%, with a decrease in productivity surpassed only by Japan, where the number of S&E publications actually decreased, falling 1.2%.
Source: NSF
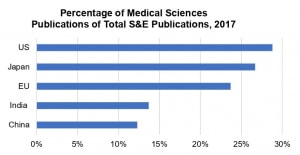
Out of the 13 S&E fields, 5 can be classified as major fields for the analytical instrument and lab products market. Among these fields, the number of S&E papers published worldwide in 2017 was the largest for Medical Sciences at 21.1%, which far outdistanced the second-largest field among the 5, Biological Sciences at 15.0%. Chemistry publications represented 7.9%, with Agricultural Sciences accounting for 2.4% and Other Life Sciences making up a scant 1.2%.
Source: NSF
One reason for the large share of Medical Sciences publications in 2017 becomes clearer looking at the world’s overall 5 leaders in S&E publication volume in 2017. For 3 of these countries, the percentage of their overall publications that were devoted to Medical Sciences grew more than 20% in 2017 (see chart). The US had the highest percentage of publications in Medical Sciences at 28.8%, as well as in the highest in Biological Sciences at 17.5%. In fact, life science fields represented 42% of Japan’s 2017 publications, 40% of the US’ and 40% of the EU’s. Likewise, the US had the highest percentage in 2 of the 5 other categories of fields among the top 5 countries: Biological Sciences, with 17.5%, and Other Life Sciences with 2.4%. China led in two categories: Chemistry at 12.6% and Agricultural Sciences at 2.7%.
Source: NSF
Another trend highlighted in the report was the increasing number of collaborations between authors in different countries over the decade, rising to 22% in 2017 from 17% in 2007. The number one collaborator on S&E publications with the US was China, which accounted for 45% of the total number of S&E articles coauthored by the US and another country in 2017. In total, 38% of S&E articles by US authors also involved at least one author from abroad in 2017, compared to 26% in 2007.
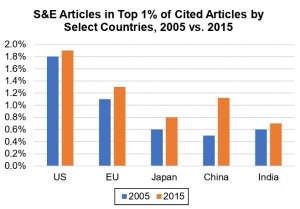
The report also tracked the countries whose S&E articles were most cited from 2005 to 2015. This percentage measures articles that are among the top 1% of articles cited worldwide relative to the total number of articles from the country. Among the top five countries in this category, the percentage increased for each over the decade (see chart). However, from 2014 to 2015, the percentage for the US dropped from 1.92% to 1.90%. Significant jumps were observed from 2014 to 2015 for China, with a leap from 1.01% to 1.12%, and for Japan, up from 0.77% to 0.83%.

