European Parliament Study Examines EU’s R&D Standing Compared to the US and China
Last month, the European Parliament’s Policy Department for Economic, Scientific and Quality of Life Policies released a study on the progress, current status and future of Europe’s R&D. The study was requested by the European Parliament’s Committee on Industry, Research and Energy. The report provided information on science and technology (S&T) developments over the past few years, contrasting the progress of EU R&D with other regions that are research powerhouses, namely the US and China, the other two comparable global R&D hubs.
Traditionally, Europe and US have largely controlled the global R&D landscape, but in recent years, investments in R&D have been growing in multiple regions. China has demonstrably proven to be a formidable power in S&T research, especially as the country has touted S&T as a key driver of economic growth and stability. Part of China’s strategy includes diminishing its dependence on foreign collaborations and technology, instead zeroing in on native innovation.
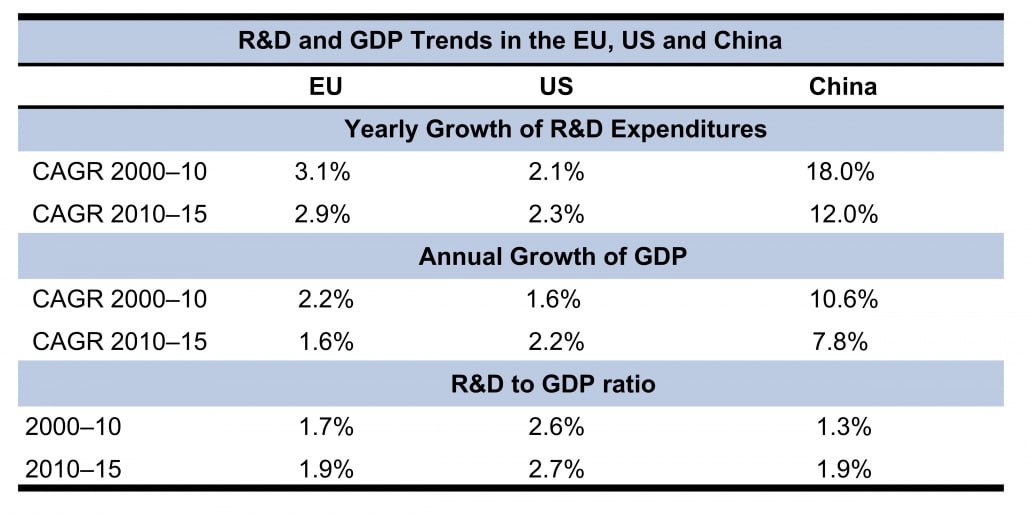
Between 2000 and 2010, China’s R&D expenditures skyrocketed at a CAGR of 18.0%, and between 2010 and 2015, its CAGR jumped an additional 12.0%. While the US still leads China and the EU in regards to its R&D as a ratio to GDP, China is steadily catching up, with its R&D to GDP ratio totaling 1.9% in 2015, the same as the EU. This indicates that the increased rate of China’s R&D spending has surpassed its already significant GDP growth rates.
Public and private contributions to R&D have increased in all three regions, but most dramatically in China, between 2000 and 2016. In all regions, R&D expenditure from the private sector has had the largest increase and serves as the main source of funds for R&D, followed by the government sector.
While the US has long been the leader of publishing scientific output, between 2007 and 2017, the EU managed to surpass the US in terms of volume of scientific output. However, China has emerged as an authority in this field as well, currently publishing more than any other country and placing the nation on par with the US. If China continues to release scientific publications at its current rate, it will easily surpass the US.
By 2017, China was at the same level or had overtaken the US and EU in regards to output in various scientific fields, including engineering, material sciences and chemical engineering, indicating the country is mostly focusing on R&D these fields. As of 2017, the EU largely leads in mathematics, molecular bio-genetics and medical sciences, although China is continuing to grow in those fields as well. Currently, the EU has the largest share of medical sciences output at 32%, while the US and China contribute 21% and 11%, respectively. The EU also leads in computer sciences research.
Data indicates that the EU is extremely open to international collaborations in science, while China and Japan are the least open. However, international collaboration has risen in China, with the share of Chinese R&D growing seven percentage points from 2006 and 2016 to 20%. Switzerland leads in international collaborations, with Sweden and the Netherlands following closely behind as of 2016.
In regards to corporate R&D, the study examined the European Commission Joint Research Center’s R&D Scoreboard, which includes 2,500 worldwide corporations that account for over 80% of global private sector R&D. In 2018, the EU had 576 companies on the Scoreboard, while China had 438. The US led the Scoreboard last year with 778 companies, with an R&D to sales ratio of 6.3% in 2018. The EU and China’s R&D to sales ratio, in contrast, was 3.4% and 2.8%, respectively. In regards to fields of specialty, the EU and the US largely focus on biopharma, with European corporate R&D also emphasizing the automotive sector.


