How the Scientific Tool Industry Fared During a 10-Plus Year US Bullish Market

Since March 2009, the US stock market has had the longest bull market in the country’s history, despite volatility. US equity markets finished the decade (2010-2019) in positive territory, as the S&P 500, the Dow Jones Industrial Average and NASDAQ rose 9.89% CAGR, 9.44% CAGR and 12.96% CAGR. The performance of scientific tool companies followed the market’s run in the 2010s and even exceeded the S&P 500 and Dow Jones Industrial Average with an 11.6% CAGR increase.
IBO, a subscription-based newsletter covering the scientific tools industry that is published twice monthly, selected 14 leading US-listed scientific tools companies* and reviewed their stock performances from 2010 to 2019 to provide an overview of how the industry has performed in the past decade. For comparison to the US stock market, the S&P 500 was utilized because the stock index encompasses a broad spectrum of industry sectors and is considered a reliable gauge of overall stock market performance.
To calculate the decade-long stock price changes for each of the 14 companies, a CAGR was calculated for their stock prices for each year from 2010 to 2019. To determine the industry’s annual performances, the 14 companies’ yearly stock price changes were averaged together and compared to the stock price change of the S&P 500. The companies’ changes of shares outstanding and stock repurchases were not factored in.
Decade Stock Price Overview
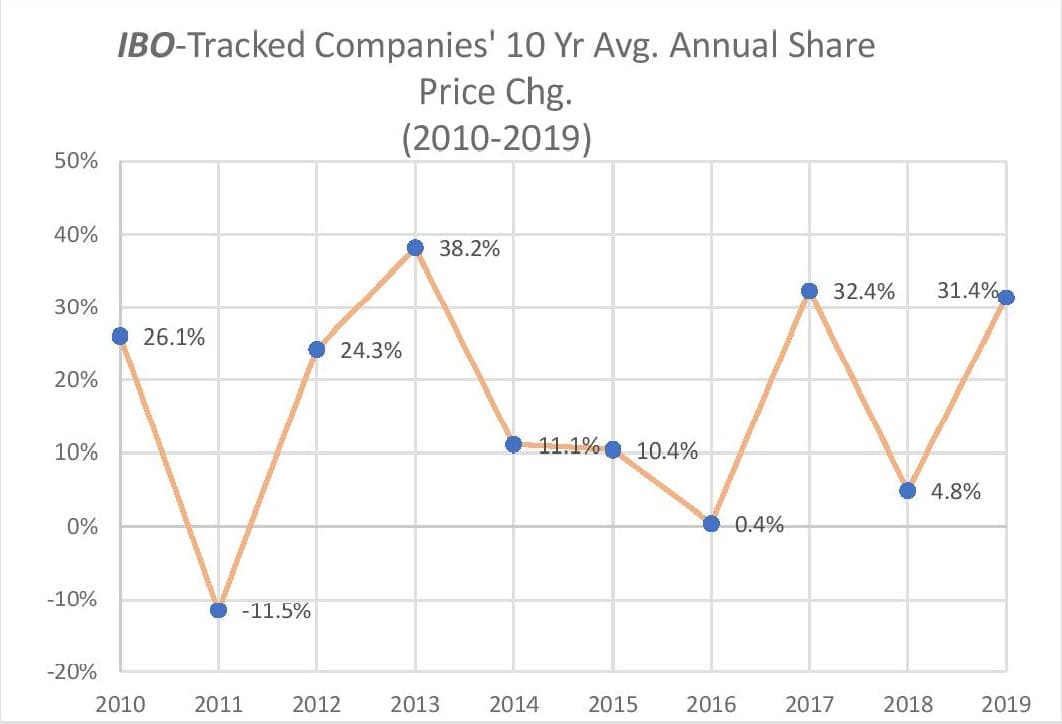
The combined stock price performance of the 14 companies was overall healthy on both an annual and a decade basis. As mentioned before, the cumulative CAGR performance of the 14 companies was 11.6% in comparison to the 9.89% CAGR for the S&P 500. 2013 was the standout year with each of the 14 companies’ share prices increasing in double digits. In fact, 6 of the 9 years saw the cumulative performance of the 14 companies rise double digits. In contrast, the worst years for the scientific tool company stocks tracked here were 2011 and 2016.
Top 5 Companies
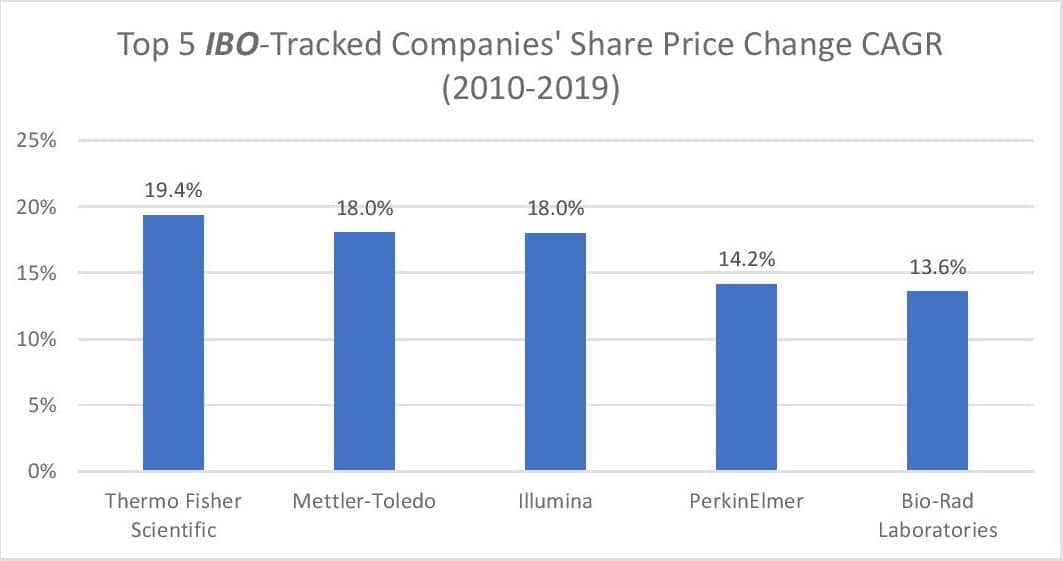
The top 5 performers among the companies tracked by IBO each posted double-digit increases in the stock price in the 2010s. The top 5 performing companies experienced mid- to high-teens growth by the end of the decade. The top 5 performers’ combined decade-long stock performance was a 16.6% CAGR versus the 9.89% CAGR of the S&P 500. In addition, each of the top 5’s stock performance exceeded the S&P 500 for the total period.
On annual basis, the top 5 performing companies tended to move in tandem with the S&P 500. For example, in 2011, all 5 companies experienced a decrease in share price along with the flat performance of the S&P 500. Also, in 5 of the 10 years showed the inverse as the S&P 500 ended in positive territory.
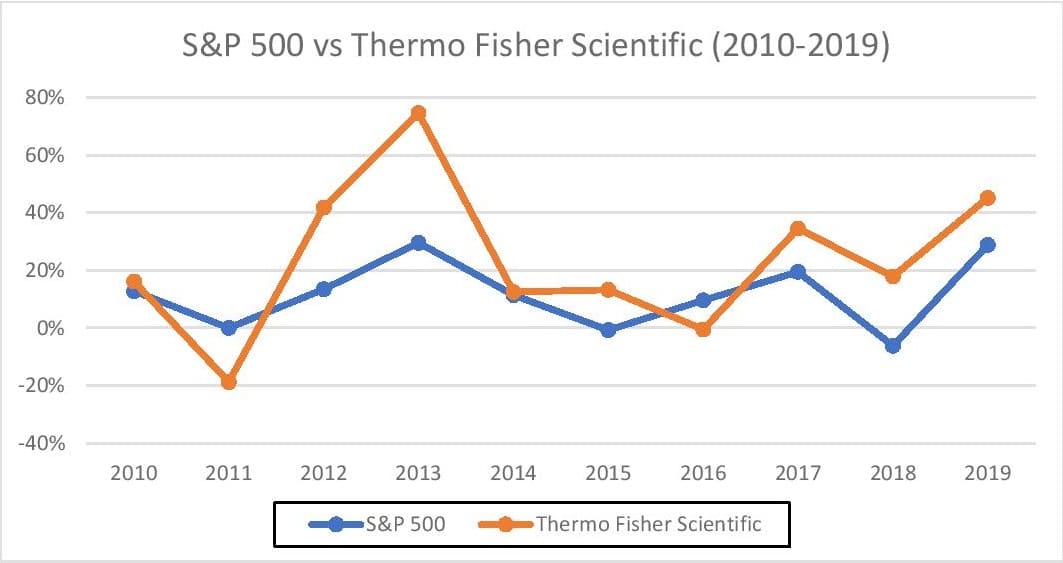
Though Illumina was the strongest gainer for most years, it was Thermo Fisher Scientific’s stable performance as well as its significant increase in share price that made it the overall top performer in the 2010s. The company ended 2010 with a stock price of $55.36 per share and ended the decade at $324.87 per share, resulting in a 19.4% CAGR. Also, the company was able to outperform the S&P 500 every year with the exception of 2011 and 2016.
Bottom 5 Companies
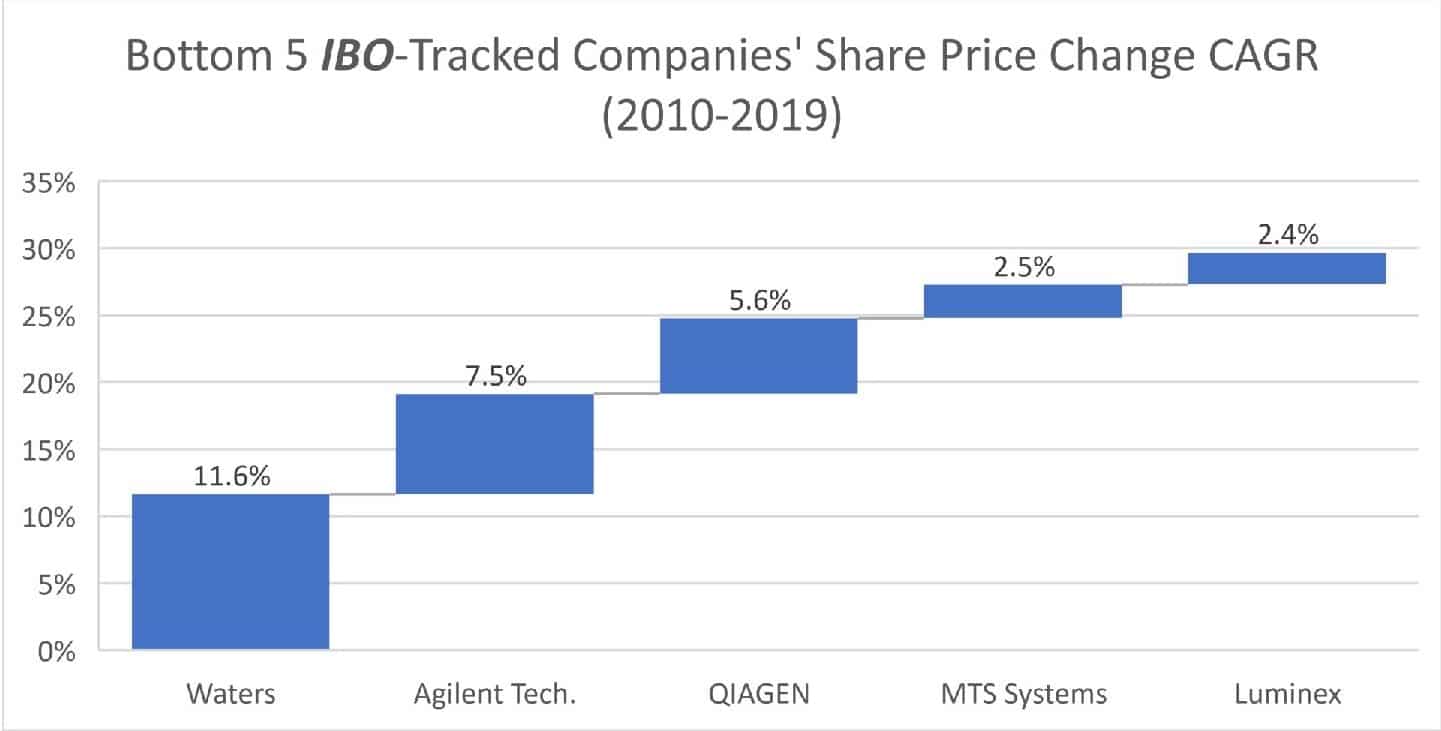
Ironically, the worst-performing companies of the 2010s were also an indicator of the strong market presence of the scientific tool industry. Each of these companies ended the decade in a favorable position with share price percentage growth ranging from the low single digits to the low teens. Unlike the top 5 performers, the combined decade-long performance of the bottom 5 performers did not exceed the S&P 500’s with just a CAGR of 5.9%. This was also the case when comparing both the bottom 5 and top 5 performers. Waters was the only company that surpassed the S&P 500 in terms of stock price percentage CAGR at 11.6%. Interestingly, the 5 worst performing companies did not move in line with the S&P 500 on a yearly basis. For example, in 2018, when the S&P 500’s stock price declined 6.2%, MTS Systems and Waters were the only companies that declined in share price.
Overall, the defining factor of the bottom 5 was the frequency of share price percentage declines for most of these companies throughout the decade. The companies that experienced double-digit decreases in share price in the 2010s were Agilent Technologies, Luminex, MTS System and QIAGEN.
Conclusion
The decade-long stock market performance of the 14 selected scientific tool companies was positive thanks to all companies delivering positive share price percentage growth. Thus, their combined annual stock market performances moved in tandem with the S&P 500, showing that the top leading scientific tools companies were following broader market trends. As the 2020s begin, the scientific tools industry looks to position itself as a reliable, significant sector in the US marketplace.
* Agilent Technologies, Becton, Dickinson and Company, Bio-Rad Laboratories, Bio-Techne, Bruker, Danaher, Illumina, Luminex, Mettler-Toledo, MTS Systems, PerkinElmer, QIAGEN, Thermo Fisher Scientific and Waters

