Federal Funding for University R&D on Upswing After Four-Year Downward Trend
After a four-year decline (see IBO 12/15/16), US federal funding for higher education R&D increased in both current and constant dollars, according to data from Higher Education Research and Development (HERD) Survey by the National Science Foundation’s (NSF) National Center for Science and Engineering Statistics. The report surveyed 902 universities and colleges that grant at least a bachelor’s degree and spent a minimum of $150,000 in 2016 on R&D. Adjusted for inflation, federal HERD funding increased 1.4% between FY15 and FY16, with universities reporting current dollar R&D expenditures of $71.8 billion in FY16, a 4.8% jump.
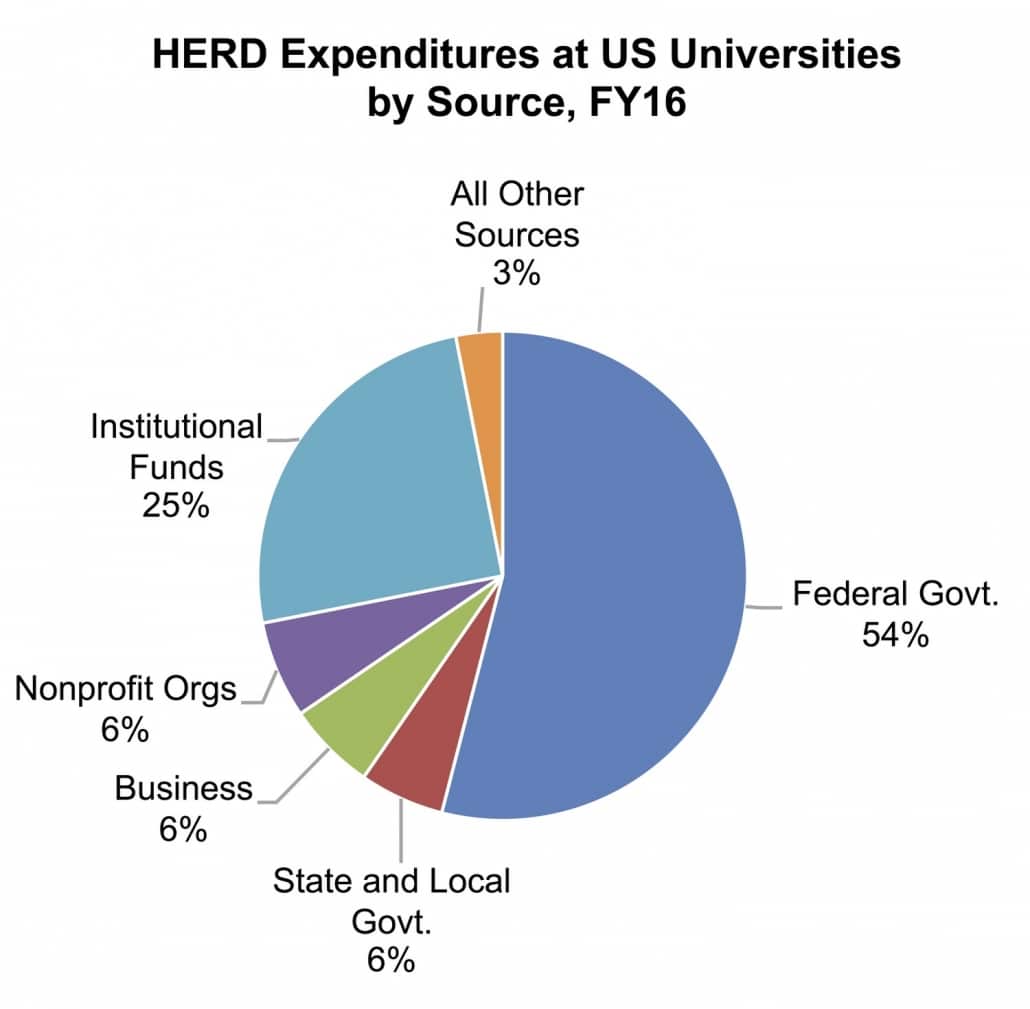
For many years, HERD has been heavily focused on health sciences, biological and biomedical sciences, and engineering, which in FY16 represented 65% of total expenditures at $22.4 billion, $13.0 billion and $11.4 billion, respectively. Although government-funded R&D at higher education institutes grew 2.5% to $38.8 billion in FY16, the share of federal funding remained on its steady six-year decline, dropping 13.6% to represent 54% of total HERD funding in FY16. All federal funding agencies increased R&D expenditures in FY16, except the NSF, for which it nominally dropped 0.1% to $5.1 billion. The greatest increases in funding came from the Department of Defense, the National Aeronautics and Space Administration, and the USDA, for which it rose 4.4%, 5.2% and 8.0% to total $5.3 billion, $1.5 billion and $1.2 billion, respectively, of total federal HERD. The Department of Health and Human Services continues to have the greatest amount of HERD with an increase of 3.3% in FY16 to $20.7 billion. The Department of Energy HERD expenditures grew 3.6% to $1.8 billion.
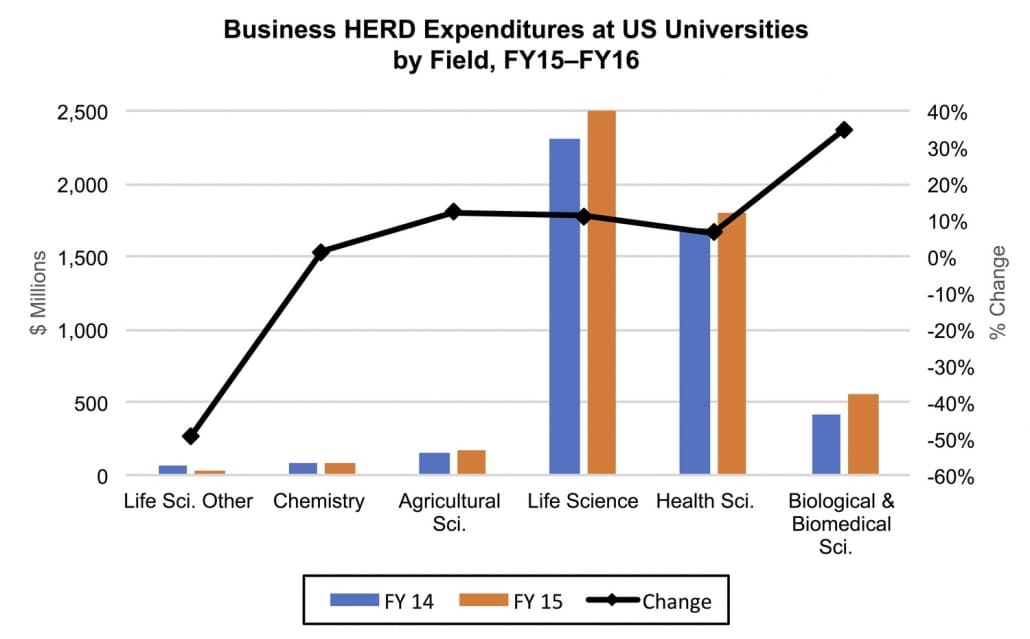
Similar to last year, all nonfederal funding sources increased in FY16, growing 7.6% to $33.0 billion. The largest increase in HERD funding from nonfederal sources was from nonprofit organizations, for which it jumped 9.4% to $4.6 billion. Business funding grew 5.2% to $4.2 billion, while state and local government HERD funding was $4.0 billion, a 4.4% increase.
Institution funds, defined as including “institutionally financed research (all R&D funded by the institution from accounts that are only used for research), cost sharing and unrecovered indirect costs (the portion of indirect costs associated with a sponsored project that was not reimbursed by the sponsor in accordance with the institution’s negotiated indirect cost rate),” increased 8.2% to $18.0 billion. In FY16, $11.5 billion of institution funds went towards direct funding of R&D and $5.1 billion was for unrecovered indirect costs, defined as “the amount of indirect costs that are not reimbursed to the institution for externally funded R&D” in the Survey. The remaining $1.4 billion was for cost sharing on sponsored projects, a figure that has remained stable since FY13. All other nonfederal funding sources rose 8.9% to $2.2 billion in FY16.
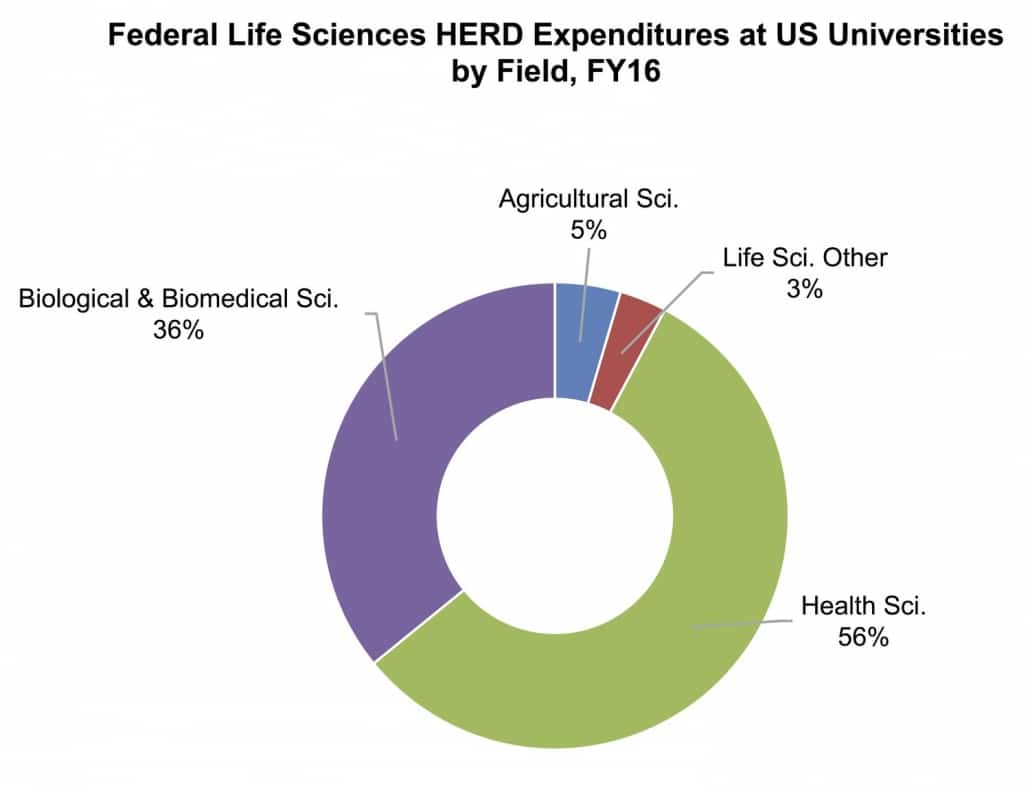
Continuing its growth trend from recent years, university R&D expenditures in FY16 for the life sciences field, which includes agricultural, biological and biomedical, and health sciences, increased 8.2% to $40.9 billion. Over 93% of university life sciences HERD, or $35.4 billion, went towards health sciences, with biological and biomedical sciences receiving $22.4 billion and $13.1 billion, respectively, in FY16.
Agricultural sciences university R&D expenditures declined 5.0% to $3.3 billion and other life sciences R&D expenditures plunged 36% to $1.5 billion. The reason for the sharp decline in the other life sciences group is due to changes in the categorization of unclassified life sciences fields, many of which were moved to the health sciences group for the FY16 HERD Survey. Within the physical sciences, university R&D expenditures increased 1.0% to $1.8 billion.
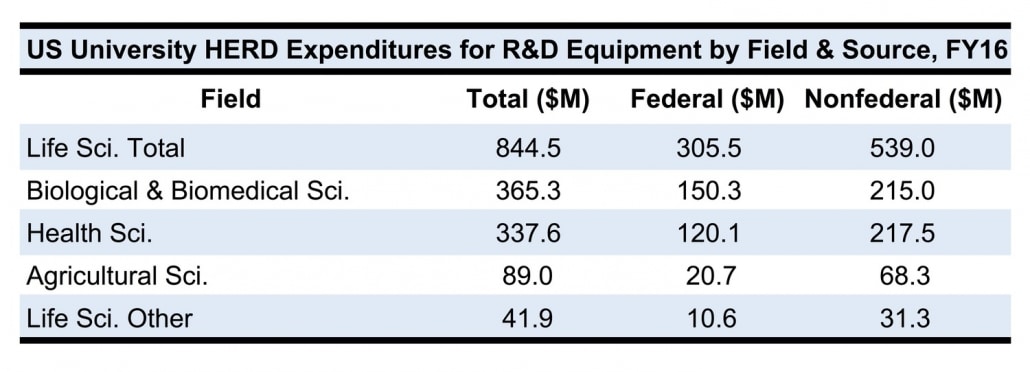
The HERD Survey also examined university R&D expenditures for equipment. The Survey defines capitalized equipment as “movable equipment exceeding the institution’s capitalization threshold, including ancillary costs such as delivery and setup.” Total HERD expenditures for equipment grew nominally in FY16 to $2.2 billion. This included $1.6 billion from public sources, a 1.5% increase, and $592.7 million from private sources, a decrease of 3.0%. HERD from private sources for equipment in the life sciences field also slightly decreased in FY16, dropping 0.5% to $255.6 million. Public HERD expenditures for life science equipment, however, increased 5.0% in FY16 to $588.9 million. The vast majority, or 83%, of total HERD expenditures for life science equipment was for the biological and biomedical science, and health science fields.
Institutional rankings for the top 30 universities for R&D expenditures remained largely the same in FY16 as the previous year, with John Hopkins again at the top of the list, spending $2.3 billion on R&D expenditures, a 3.4% increase. New York University jumped 12 spots from its FY15 ranking of number 35 to number 23 in FY16, bumping the University of Texas out of the top 30. New York University increased R&D expenditures 34.6% to $810 million, which was partially driven by a rise in expenditures at its Abu Dhabi campus in Dubai. Combined, the top 30 US institutions for R&D expenditures reported $30.2 billion spent for HERD in FY16, a 6.4% increase.


