A Steady Increase: China’s Science & Engineering Publications

The number of science and engineering (S&E) journal articles and conference proceedings grew 3.8% on average annually between 2008 and 2018 to reach 2.6 million, according to a new report released by the NSF, “Publications Output: U.S. Trends and International Comparisons.” The figures are drawn from a survey of the Scopus database of S&E publications, which catalogs articles and proceedings from 24,000 peer-reviewed journals worldwide. China’s rising profile in the scientific world is evident from the report, which breaks down data by the leading countries for S&E publications. Papers are categorized by the region/country in which the author’s university is located and fractionally divided in the case of coauthors from different countries.
From 2008 to 2018, China’s total number of S&E publications grew at an annual average rate of 7.8% to reach 528,263. In contrast, among the 15 most prolific countries, the fastest gainers grew 11%, with Iran responsible for 48,306 papers, and 135,788 papers attributed to India. The only other country with faster growth than China was Russia, whose number of publications increased 9.9% to 81,579. The second-largest cumulative count for the period belonged to the US with 422,808 papers, but it recorded an average annual growth rate of only 1.0%.
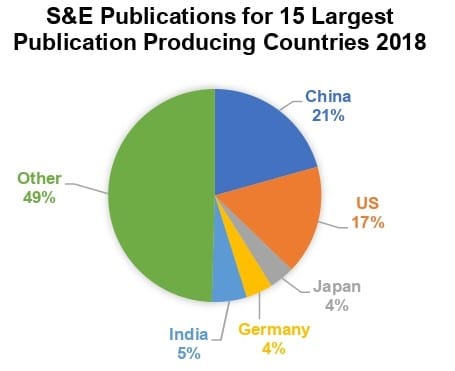
Figure 1
Source: NSF
In 2018, the greatest number of S&E papers among the 15 countries examined were from China, accounting for 21% of the total (Figure 1); a consistent increase compared with a shares of 14% in 2008 and 20% last year. The US had the second-largest percentage at 17%.
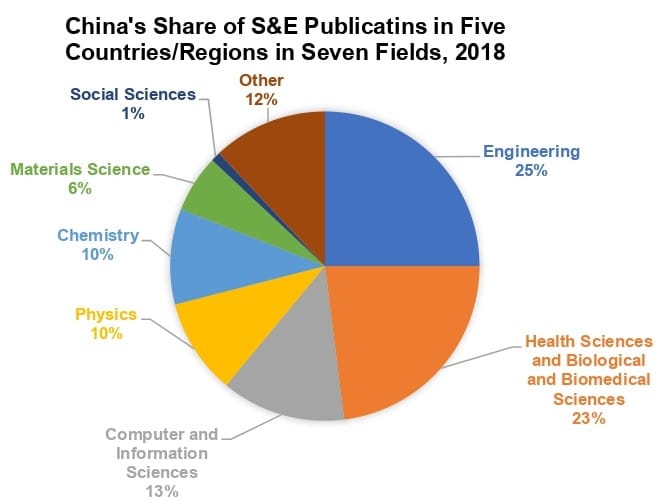
Figure 2
Source: NSF
Comparing the percentage of 2018 publications in 7 fields for 5 countries/regions—China, the EU, India, Japan and the US—China had the highest percentage in Engineering and Chemistry (Figure 2). But in the fields of Health Sciences and Biological and Biomedical Sciences, which accounted for 36%, the largest share, of all S&E publications across the 5 countries/regions, China had the lowest share at just 23%. The US, the leading country in that field, had a 48% share.
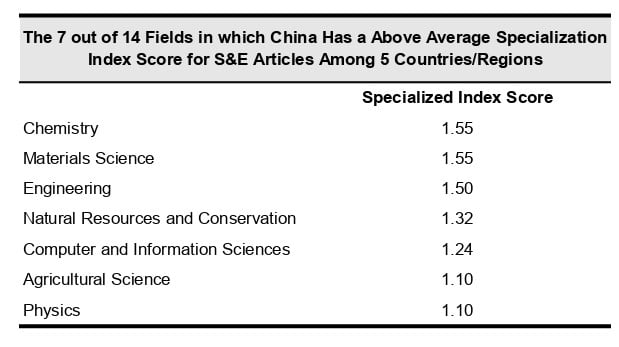
Table 1
Source: NSF
To measure how countries’ number of S&E papers compared by scientific field, the report uses a specialization index, which normalizes a country’s publication share based on field (index value = 1.0). For the 14 fields analyzes, China had an above-average index score among the 5 countries/regions in 7 fields (Table 1), and the highest among the 5 countries/regions in Engineering, Chemistry, and Natural Resources and Conservation. In Agricultural Sciences, Computer and Information Sciences, and Materials Science, China had the second-highest index scores, trailing only India in each.
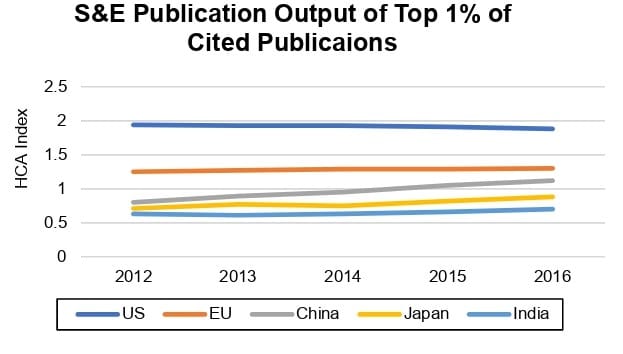
Figure 3
Source: NSF
Using citations to determine an article’s influence on a specific field, the report calculates the top 1% of articles most cited, termed highly cited articles (HCAs). An index compares a country’s HCA with the HCA globally. China’s HCA index score came in at 1.12 for 2016 (Figure 3), the latest year for which HCAs were available. The highest HCAs index score among China, the EU, India, Japan and US was 1.9 for the US. India’s was the lowest at 0.7.
However, China had the fastest HCA index score growth for these countries/regions between 2006, when it was 0.51, and 2016, when it totaled 1.12, the third-highest score among the countries/regions. Measured by both volume and impact, China led the five countries/regions in the field of Computer and Information Sciences with an above-average HCA index score for each in 2016.
Despite the surge in China’s number of S&E publications, the country had one of lowest international collaboration rates in 2018 among the top five countries—China, Germany, India, Japan and the US. China had the second-lowest collaboration rate at 22% for all S&E publications, slightly higher than India’s collaboration rate of 18%. At 53%, Germany had the highest collaboration rate among the five countries.
China’s most frequent collaborator last year was the US, with the countries together producing 55,382 papers out of a total of 126,868 papers coauthored by China. One possible reason for the high rate is that the US is the most popular destination for doctorate recipients from China who were studying aboard. The US far outdistanced China’s second-largest collaboration partner, the UK, which coauthored 14,763 papers with China.

