Pharmaceutical Sales and R&D Trends
A new report from the US Congressional Budget Office (CBO) provides a snapshot of the US pharmaceutical industry and its R&D patterns. The report also explains the important role that the federal government plays in drug development and sales. Here, IBO gives an overview of the data presented in the report on pharmaceutical sales and R&D.
In 2019, worldwide drug sales fell 9.3% to $275.42 billion according to members of PhRMA (Pharmaceutical Research and Manufacturers of America), the largest US pharma industry trade organization whose members primarily consist of large firms. In contrast, the data shows members’ sales rising 19.3% in 2018. Prior to 2019, the last year in which revenues declined was 2013, when they slipped 3.0%.
Source: CBO
It is key to note that PhRMA’s analysis may not fully indicate the influence of the industry’s smaller companies. As the report notes, much of pharmaceutical industry R&D takes place at smaller firms, which are less likely to be represented among PhRMA membership. In fact, 70% of the almost 3,000 drugs in Phase 3 clinical trials are from pharmaceutical companies with less than $500 million in revenues.
Year-to-year variability in sales growth of PhRMA members can be better tracked through annual averages over five-year periods. In which case, worldwide drug sales for PhRMA firms improved, rising from essentially flat sales on average from 2010 to 2014 to a 4.4% average increase from 2015 to 2019.
Because it takes an average of 10 years to develop a drug, sales over the 2015–2019 period may be particularly indicative of R&D expenditures between 2005 and 2009. During that period, R&D spending rose only 1.2%, reflecting declines in 2005, 2008 and 2009. Thus, despite a relatively small increase in R&D expenses for the 2005 to 2009 period, sales increased in 2015–2019.
But there are number of variables affecting the success of drug development. A key one is US FDA approval. Without it, drugs cannot come to market in the US, the country with the largest demand for pharmaceuticals. The success rate is low with only 12% percent of drugs that begin clinical trials eventually approved by the US FDA. The European Medicines Agency (EMA) comes to the same decision as the FDA in more than 90% of cases, so failure at one agency is tantamount to losing access to the majority of the global market for branded pharmaceuticals.
Between 2010–2014 and 2015–2019, the R&D periods likely to reflect drugs approvals in 2015–2019, the US FDA’s approval rate of new molecular entities (NMEs) declined from 32.3% to 26.0% to reach 32 NMEs in 2019. However, the report does not distinguish between PhRMA member non-PhRMA members’ drug approvals.
Driving the increase in FDA approvals in 2015–2019 were biologic drugs, whose average approval rate rose from 82.4% in 2010–2014 to 93.5% over the subsequent five years. This reflects approval of an average of 6.3 biologics from 2010–2014 to 2015–2019 to an average of 12.0. Many biologic drugs are developed by smaller firms, though these firms are regularly acquired by major pharmaceutical firms.
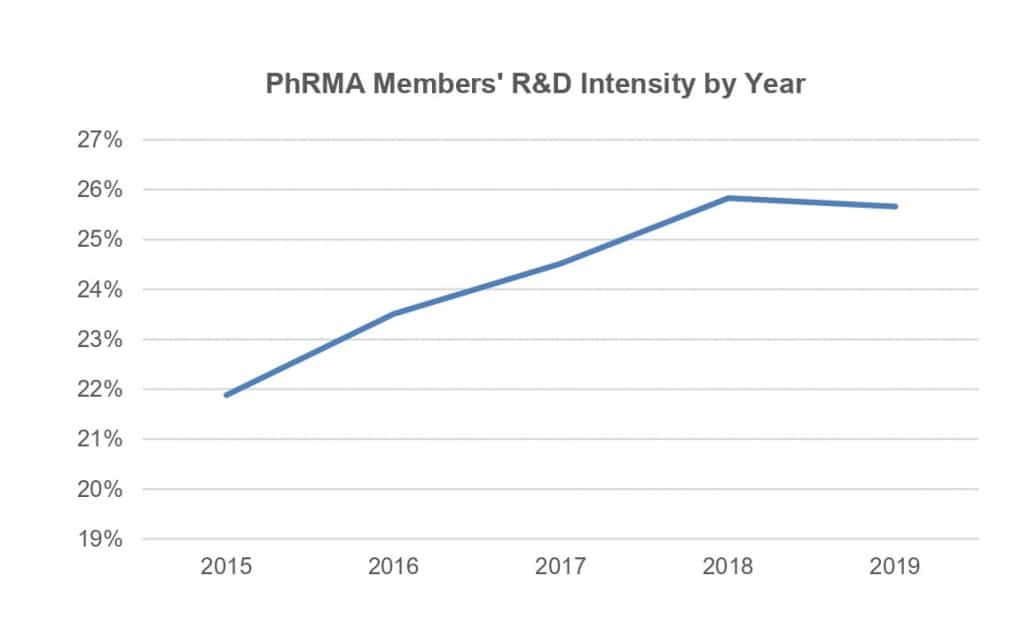
In another measure, average R&D intensity (the percentage of R&D spent per company sales) for PhRMA companies grew from 19.16% in 2005–2009 to 24.28% in 2015–2019. But sales grew faster than R&D when comparing the two periods, as discussed above, but R&D may be becoming more efficient. For example, companies may have become better at advancing the drug candidates that are more likely to have high sales, or they may have gained more drug approvals and sales by acquiring companies rather than through internal development.
Due to the multiple variables involved, it is hard to determine the exact relationship between prior pharmaceutical R&D spending and recent pharmaceutical sales. However, in the periods examined, recent sales growth outpaced prior R&D spending despite a decline in FDA approvals. The rise of smaller biotech companies and big pharma’s acquisitions complicates the picture and shows how much drug development is changing.
For more information on the the scientific tools used in drug development, subscribe to IBO, a bimonthly newsletter, and for access to market data on scientific tool industry, visit SDi.


